Grafana Dashboard
This topic describes the Grafana Dashboard, which is part of each a9s Prometheus Data Service instance.
Opening the Dashboard
To open the Grafana Dashboard see the Service Instance Access - Access a9s Prometheus Dashboards section of the documentation.
Copying an a9s Provided Dashboard Template
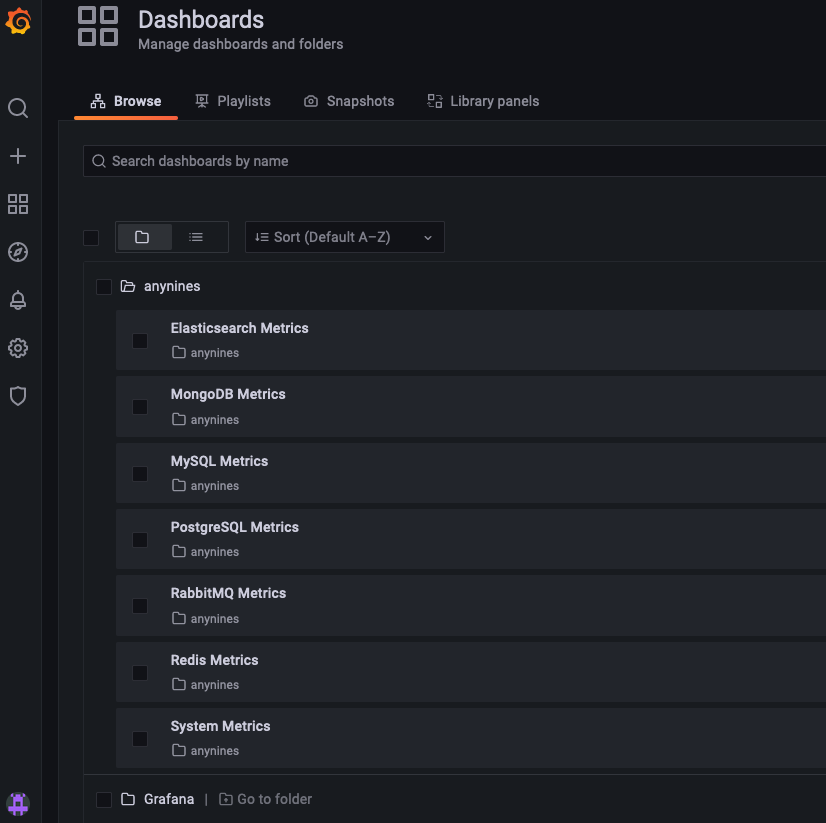
anynines provides Dashboard templates which can be used as a base for your own dashboard. As the anynines Dashboards are just templates you have to save them under another name before you can use them.
To do that, open the dashboard overview and browse the existing folders.
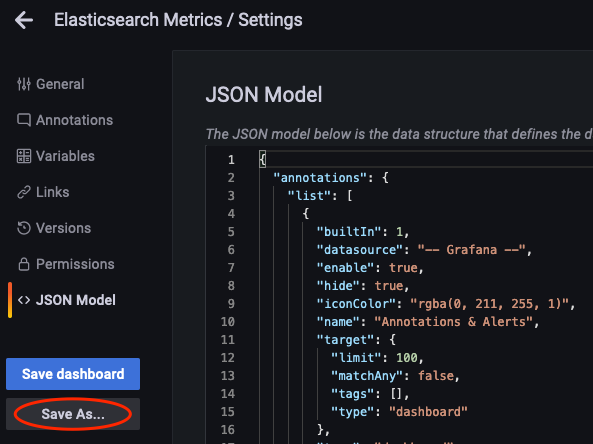
Then, open the dashboard you want to copy and click the Settings button in the upper right corner.
Now you can save the dashboard under a different name by clicking the "Save As" button.
Alerting
Unified Alerting is the main alerting system in Grafana. We recommend taking a look at the Grafana documentation to get familiar with the alerting.
The default data source associated with Grafana is Prometheus, which is part of the a9s Prometheus Service Instance. You can add other data sources as well, but this depends on the network topology. anynines, as the provider for the automation of the a9s Prometheus Service, cannot guarantee that every available plugin will work, as this may be limited by your cloud provider's network. Please contact your Platform Operator.
Contact Points
Contact points are used in Grafana to define how your contacts are notified when an alarm is fired. Grafana supports different notifiers which can be configured via the Grafana Dashboard. Please consult your Platform Operator to determine which notifiers can be used depending on the restrictions in the network.
Email Notifiers
SMTP settings are required to use the email notifier and cannot be configured per Service Instance. Currently, only a global setting is possible.


