Using a9s Prometheus
This chapter describes how to use a9s Prometheus.
Use a9s Prometheus with an App
To use a9s Prometheus, you can follow the procedures in the create a Service Instance and a service key sections. For more information on managing Service Instances, see Managing Service Instances with the cf CLI.
View the a9s Prometheus Service
After the service is installed, a9s-prometheus and its service plans appear in your CF marketplace. You can run the
cf marketplace command to see the service listing:
$ cf marketplace
Getting services from marketplace in org test / space test as admin...
OK

service            plans                                                                                              description
a9s-prometheus     prometheus-single-small, prometheus-single-medium, prometheus-single-big   This is the a9s Prometheus service.
See the next section for instructions on creating a9s Prometheus Service Instances based on the plans listed in the
cf marketplace output.
Create a Service Instance
To provision a Prometheus system, run cf create-service. For example:
cf create-service a9s-prometheus prometheus-single-small my-prometheus-service
Depending on your infrastructure and service broker usage, it may take several minutes to create the Service Instance.
Check the creation status using cf services. This displays a list of all your Service Instances. To check the status
of a specific Service Instance, run cf service NAME-OF-YOUR-SERVICE.
Bind an Application to a Service Instance
After you created your Service Instance, run cf bind-service to bind the Service Instance to your application:
cf bind-service a9s-prometheus-app my-prometheus-service
Restage or Restart Your Application
To enable your app to access the Service Instance, run cf restage or cf restart to restage or restart your app.
Obtain Service Instance Access Credentials
After a Service Instance is bound to an application, the credentials of your Prometheus system are stored in the
environment variables of the application. Run cf env APP-NAME to display the environment variables.
You can find the credentials in the VCAP_SERVICES key.
$ cf env a9s-prometheus-app
Getting env variables for app a9s-prometheus-app in org test / space test as admin...
OK

System-Provided:
{
 "VCAP_SERVICES": {
  "a9s-prometheus": [
   {
    "credentials": {
     "alertmanager_urls": [
      "EXAMPLE_ALERTMANAGER_URL"
     ],
     "grafana_urls": [
      "EXAMPLE_GRAFANA_URL"
     ],
     "graphite_exporter_port": 9109,
     "graphite_exporters": [
      "EXAMPLE_GRAPHITE_URL"
     ],
     "password": "EXAMPLE-PASSWORD",
     "prometheus_urls": [
      "EXAMPLE_PROMETHEUS_URL"
     ],
     "username": "EXAMPLE-USERNAME"
    },
    "label": "a9s-prometheus",
    "name": "my-prometheus-service",
    "plan": "prometheus-single-small",
    "tags": [
     "metrics",
     "logging",
     "alerting",
     "monitoring",
     "prometheus"
    ]
   }
  ]
 }
}
...
You can use the alertmanager_urls, grafana_urls, prometheus_urls, username and password values to connect to
the different APIs within your application.
Best Practices
There are some best practices for using service binding information in apps in a separate document.
Stream a9s Service Instance Metrics to a9s Prometheus
To use an a9s Prometheus Service Instance to monitor another a9s Service Instance, follow the first two steps of Use a9s Prometheus with an App.
Create a Service Key
After the a9s Prometheus Service Instance has been created, run
cf create-service-key my-prometheus-service my-service-key to create a new service key for your Service Instance:
$ cf create-service-key my-prometheus-service my-service-key
Creating service key my-service-key for service instance my-prometheus-service as admin...
OK
To retrieve the required information from your service key, run $ cf service-key my-prometheus-service my-service-key:
$ cf service-key my-prometheus-service my-service-key
Getting key my-service-key for service instance my-prometheus-service as admin...

{
 "alertmanager_urls": [
  "http://d00a2c-alertmanager-0.node.dc1.consul:9093/service-instances/2fe38eeb-e3a0-4d18-86bc-1c0c0b0e303f/alertmanager/"
 ],
 "grafana_urls": [
  "http://d00a2c-grafana-0.node.dc1.consul:3000/service-instances/2fe38eeb-e3a0-4d18-86bc-1c0c0b0e303f/grafana/"
 ],
 "graphite_exporter_port": 9109,
 "graphite_exporters": [
  "d00a2c-prometheus-0.node.dc1.consul"
 ],
 "password": "a9s70e5d011f061afff3e4af8073aad09d3a058511a",
 "prometheus_urls": [
  "http://d00a2c-prometheus-0.node.dc1.consul:9090/service-instances/2fe38eeb-e3a0-4d18-86bc-1c0c0b0e303f/prometheus/"
 ],
 "username": "a9s-brk-usr-1f4553994f7a617f23ed4efa629ea7199e2a44d0"
}
Please note the fields graphite_exporters and graphite_exporters_port which will be used in the next step.
Update a a9s Service Instance
The cf update-service command used with the -c flag
can let you stream your metrics to a third-party service. In this case, the command expects a JSON string containing the
graphite key. This key contains the combination of the host and port where the Graphite metrics should be sent to.
You can retrieve this information from the previously created service key of your a9s Prometheus Service Instance, you
need the values from the fields graphite_exporters and graphite_exporters_port.
$ cf update-service service-instance-to-monitor -c '{"graphite": ["d00a2c-prometheus-0.node.dc1.consul:9109"]}'
For more a9s Data Service specific information, like the available metrics, metrics frequency, etc., see the following pages:
See the a9s Service Instance Metrics
Once your monitored Service Instance is streaming into your a9s Prometheus you can use the Prometheus Dashboard to see the streamed metrics.
Stop Streaming a9s Service Instance Metrics
Follow the steps below to stop streaming Service Instance metrics to a9s Prometheus.
Overwrite Your Service Instance Configuration
If you want to stop streaming your Service Instance metrics to your a9s Prometheus Service Instance, you can overwrite
the graphite key of your Service Instance configuration.
Run cf update-service INSTANCE-NAME -c PARAMETERS-AS-JSON to update the Graphite endpoint of the Service Instance you
don't want to monitor anymore. For this, you need to overwrite the value of the graphite key with an empty array.
$ cf update-service service-instance-to-monitor -c '{"graphite": []}'
Delete the Service Key and Service Instance
You may want to delete the service key and the a9s Prometheus Service Instance itself, if you are not using it anymore.
Run cf delete-service-key INSTANCE-NAME SERVICE-KEY-NAME and cf delete-service INSTANCE-NAME to do so.
$ cf delete-service-key my-prometheus-service my-service-key
Really delete the service key my-service-key?> y
Deleting service key my-service-key for service instance my-prometheus-service as admin...
OK

$ cf delete-service my-prometheus-service
It may take several minutes to delete the Service Instance. Deleting a Service Instance deprovisions the corresponding
infrastructure resources. Run the cf services command to view the deletion status.
Stream Application Metrics to a9s Prometheus
Prometheus is designed to aggregate scraped data from various targets into its time series database. So, it can be as simple as implementing a metrics endpoint and allowing Prometheus to query that endpoint.
Due to network restrictions depending on the cloud environment, scraping targets can't be used easily. Therefore we will have a look at different options to stream your application metrics to an a9s Prometheus Service Instance.
Using a Custom Scrape Target
If your application implements a metrics endpoint and there are no network restrictions in your cloud environment, you can configure your application as a scrape target in your a9s Prometheus Service Instance. For more information see Scrape Configs.
Using the Graphite Exporter
a9s Prometheus contains a Graphite Exporter endpoint to which you can stream metrics. By default, the Graphite Exporter has rules defined to map Graphite compliant metrics to Prometheus compliant metrics with labels.
Additionally, via the strict matching settings, the Graphite Exporter filters metrics which don't match these rules. In order to allow the a9s Prometheus Service Instance to receive metrics other than the configured ones, you have to switch off the strict matching settings. For more information see here.
Create a Service Key to get Information about your Service Instance
Create a service key to get URLs of your a9s Prometheus Service Instance:
$ cf create-service-key my-prometheus-service my-key
$ cf service-key my-prometheus-service my-key

{
 "alertmanager_urls": [
  "http://d00a2c-alertmanager-0.node.dc1.consul:9093/service-instances/2fe38eeb-e3a0-4d18-86bc-1c0c0b0e303f/alertmanager/"
 ],
 "grafana_urls": [
  "http://d00a2c-grafana-0.node.dc1.consul:3000/service-instances/2fe38eeb-e3a0-4d18-86bc-1c0c0b0e303f/grafana/"
 ],
 "graphite_exporter_port": 9109,
 "graphite_exporters": [
  "d00a2c-prometheus-0.node.dc1.consul"
 ],
 "password": "a9s70e5d011f061afff3e4af8073aad09d3a058511a",
 "prometheus_urls": [
  "http://d00a2c-prometheus-0.node.dc1.consul:9090/service-instances/2fe38eeb-e3a0-4d18-86bc-1c0c0b0e303f/prometheus/"
 ],
 "username": "a9s-brk-usr-1f4553994f7a617f23ed4efa629ea7199e2a44d0"
}
Configure your application to stream its metric to the graphite_exporters endpoint and port graphite_exporter_port.
Using a Sidecar
Instead of using the Graphite Exporter directly in your application, you can also use a Sidecar that scrapes the metrics endpoint of your application and streams them to the Graphite Exporter. For more information see Using a Sidecar to Collect Application Metrics With a9s Prometheus.
See the Application Metrics
Once your monitored application is streaming into your a9s Prometheus Service Instance you can use the Prometheus Dashboard to see the streamed metrics.
Stop Streaming Application Metrics to a9s Prometheus
Depending on the approach you are using to stream your application metrics to your a9s Prometheus Service Instance, you have to execute different steps.
Stop Using a Custom Scrape Target
If you want to stop your a9s Prometheus Service Instance from scraping your application, you have to update your Service Instance and remove your application as a target from the scrape configs.
$ cf update-service my-prometheus-service -c '{ "scrape_configs": [] }'
Stop Using the Graphite Exporter
If you want to stop your application from streaming its metrics to your a9s Prometheus Service Instance, you have to
change the configuration of your application and remove both the graphite_exporters endpoint and the
graphite_exporter_port port.
You can also delete the service key that contains the properties and credentials you used in your application.
$ cf delete-service-key my-prometheus-service my-key
Stop Using a Sidecar
If you are using the Sidecar approach, you have to unbind your application from your a9s Prometheus Service Instance.
$ cf unbind-service my-app my-prometheus-service
Access the a9s Prometheus Dashboards
You have to execute the following command to get the required information to access the dashboards of your a9s Prometheus Service Instance:
cf service my-prometheus-service
you will get an output similar to this:
Showing info of service my-prometheus-service in org test / space test as admin...

name:             my-prometheus-service
service:          a9s-prometheus
tags:
plan:             single-small
description:      This is a service creating and managing dedicated Prometheus to monitor applications and Service Instances, powered by the anynines Service Framework
documentation:    https://docs.anynines.com
dashboard:        https://a9s-dashboard.system.a9s-ds-concourse.a9s-ops.de/service-instances/2fe38eeb-e3a0-4d18-86bc-1c0c0b0e303f
service broker:   prometheus-service-broker

Showing status of last operation from service SERVICE_NAME...

status:    update succeeded
message:
started:   2022-01-20T08:48:11Z
updated:   2022-01-20T08:49:18Z

There are no bound apps for this service.
Extract the dashboard URL from the command's output, in the example above:
https://a9s-dashboard.system.a9s-ds-concourse.a9s-ops.de/service-instances/2fe38eeb-e3a0-4d18-86bc-1c0c0b0e303f
Grafana Dashboard
To access the Grafana dashboard, you have to append grafana to the URL:
https://a9s-dashboard.system.a9s-ds-concourse.a9s-ops.de/service-instances/2fe38eeb-e3a0-4d18-86bc-1c0c0b0e303f/grafana
For more information on the usage of the Grafana Dashboard see the Grafana Dashboard page.
Prometheus Dashboard
To access the Prometheus dashboard, you have to append prometheus to the URL:
https://a9s-dashboard.system.a9s-ds-concourse.a9s-ops.de/service-instances/2fe38eeb-e3a0-4d18-86bc-1c0c0b0e303f/prometheus
The Prometheus dashboard allows you to visualize the streamed/scraped metrics.
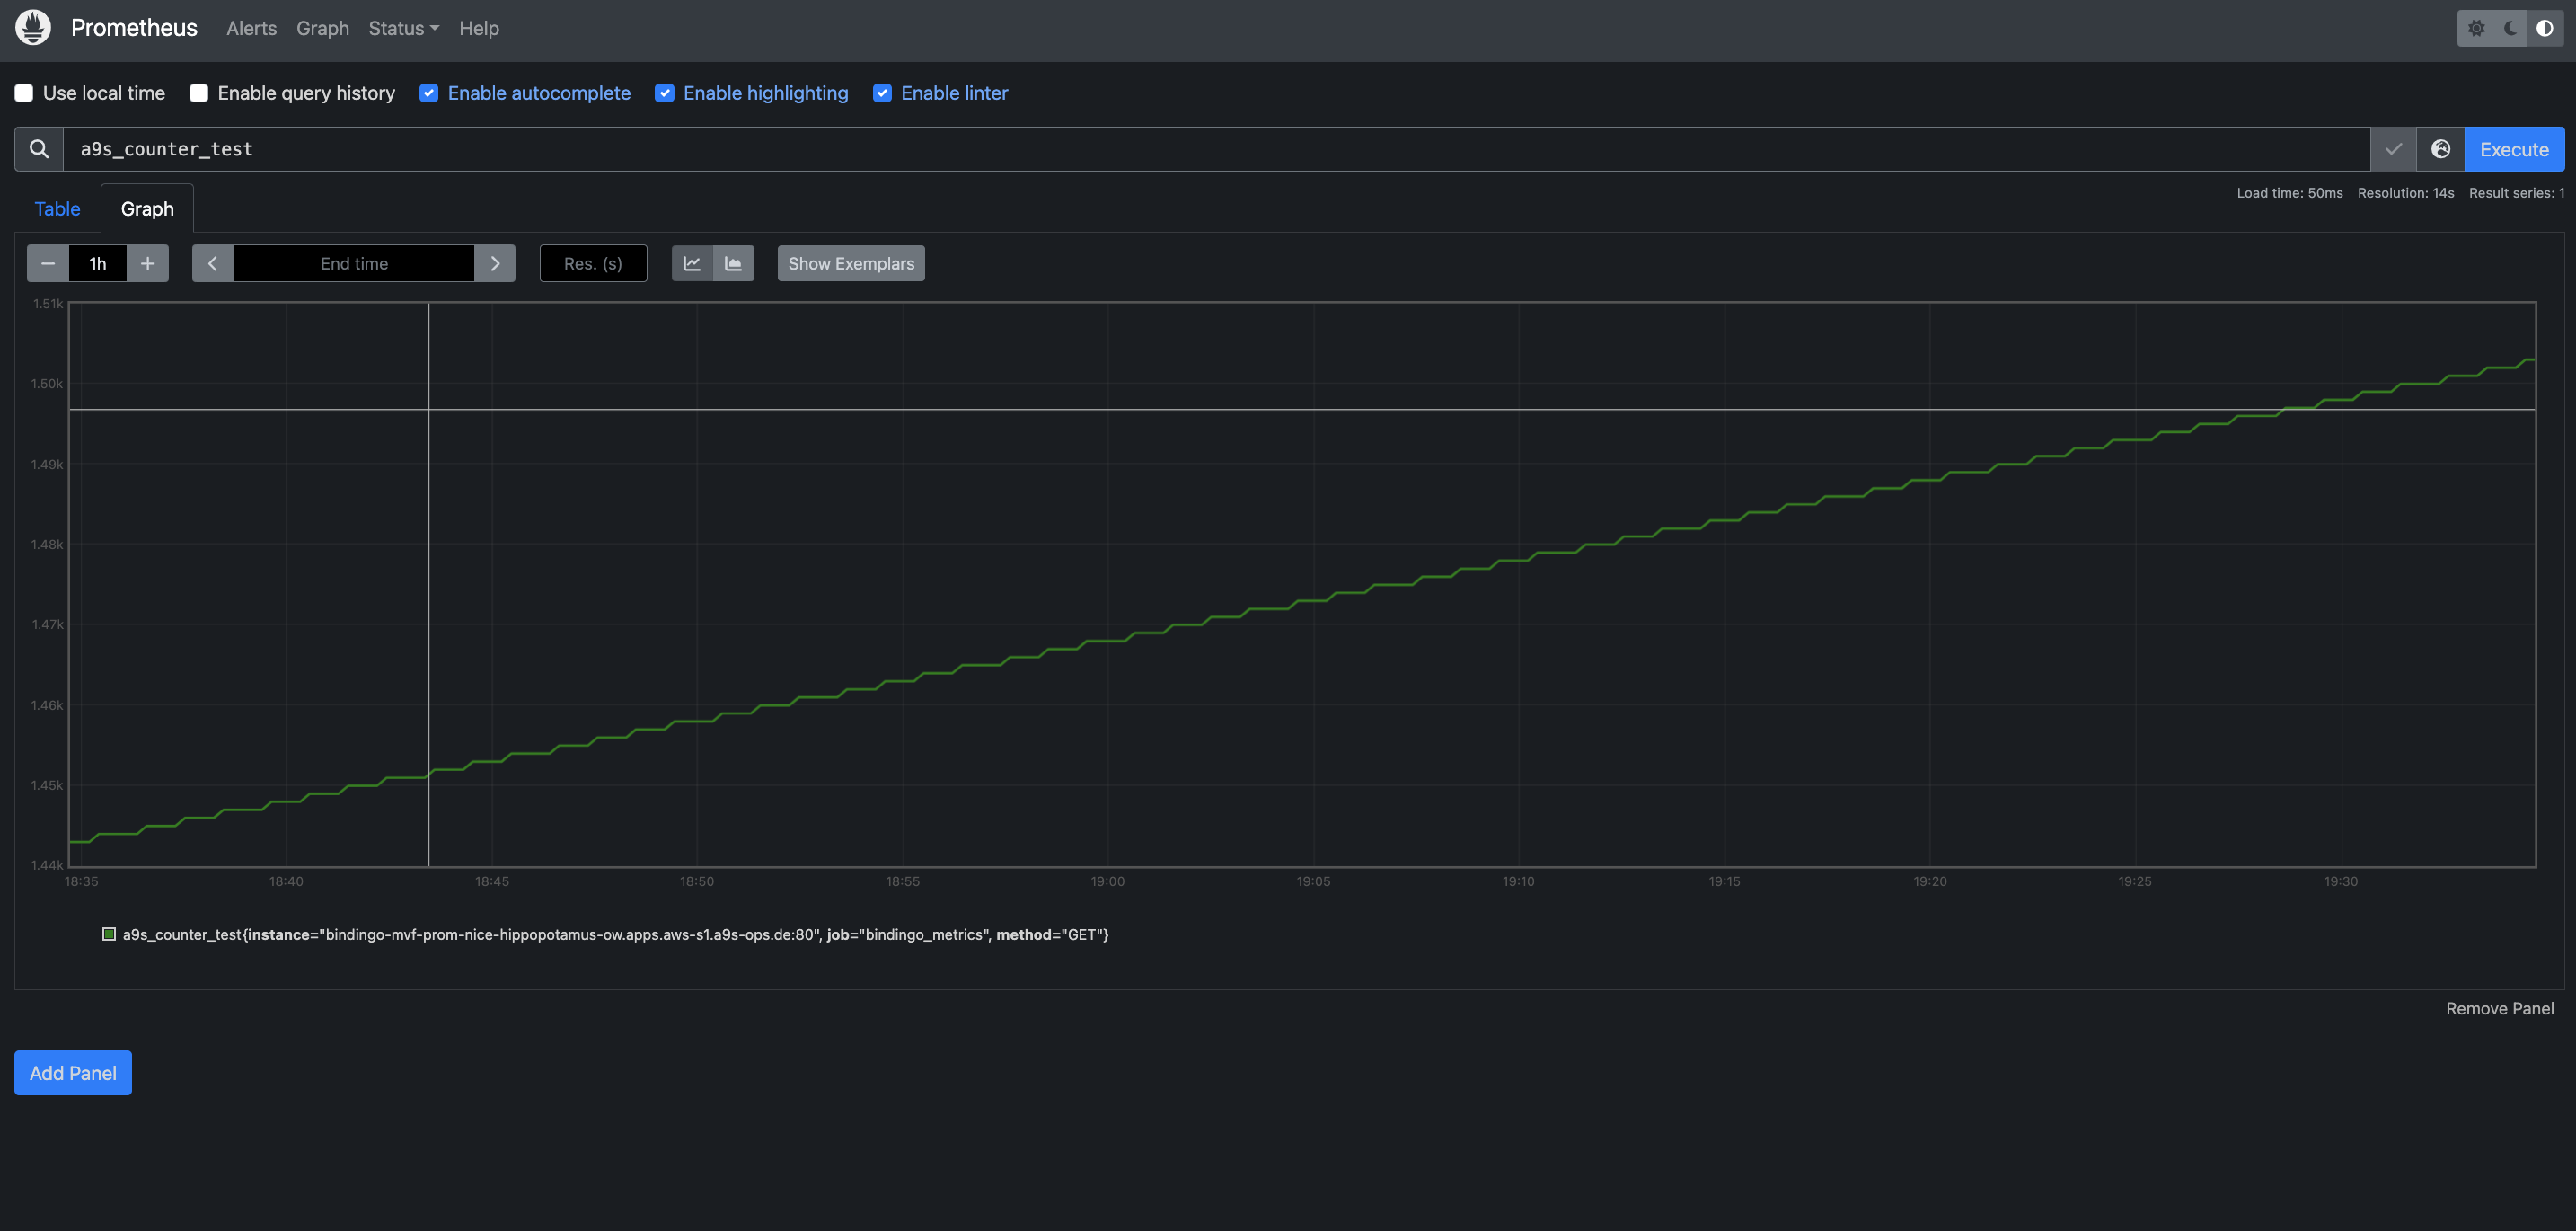
See the Streamed Metrics
For the following example, we will use an a9s PostgreSQL as the Service Instance to monitor.
Open the Prometheus Dashboard, which should redirect to the
Graphpage: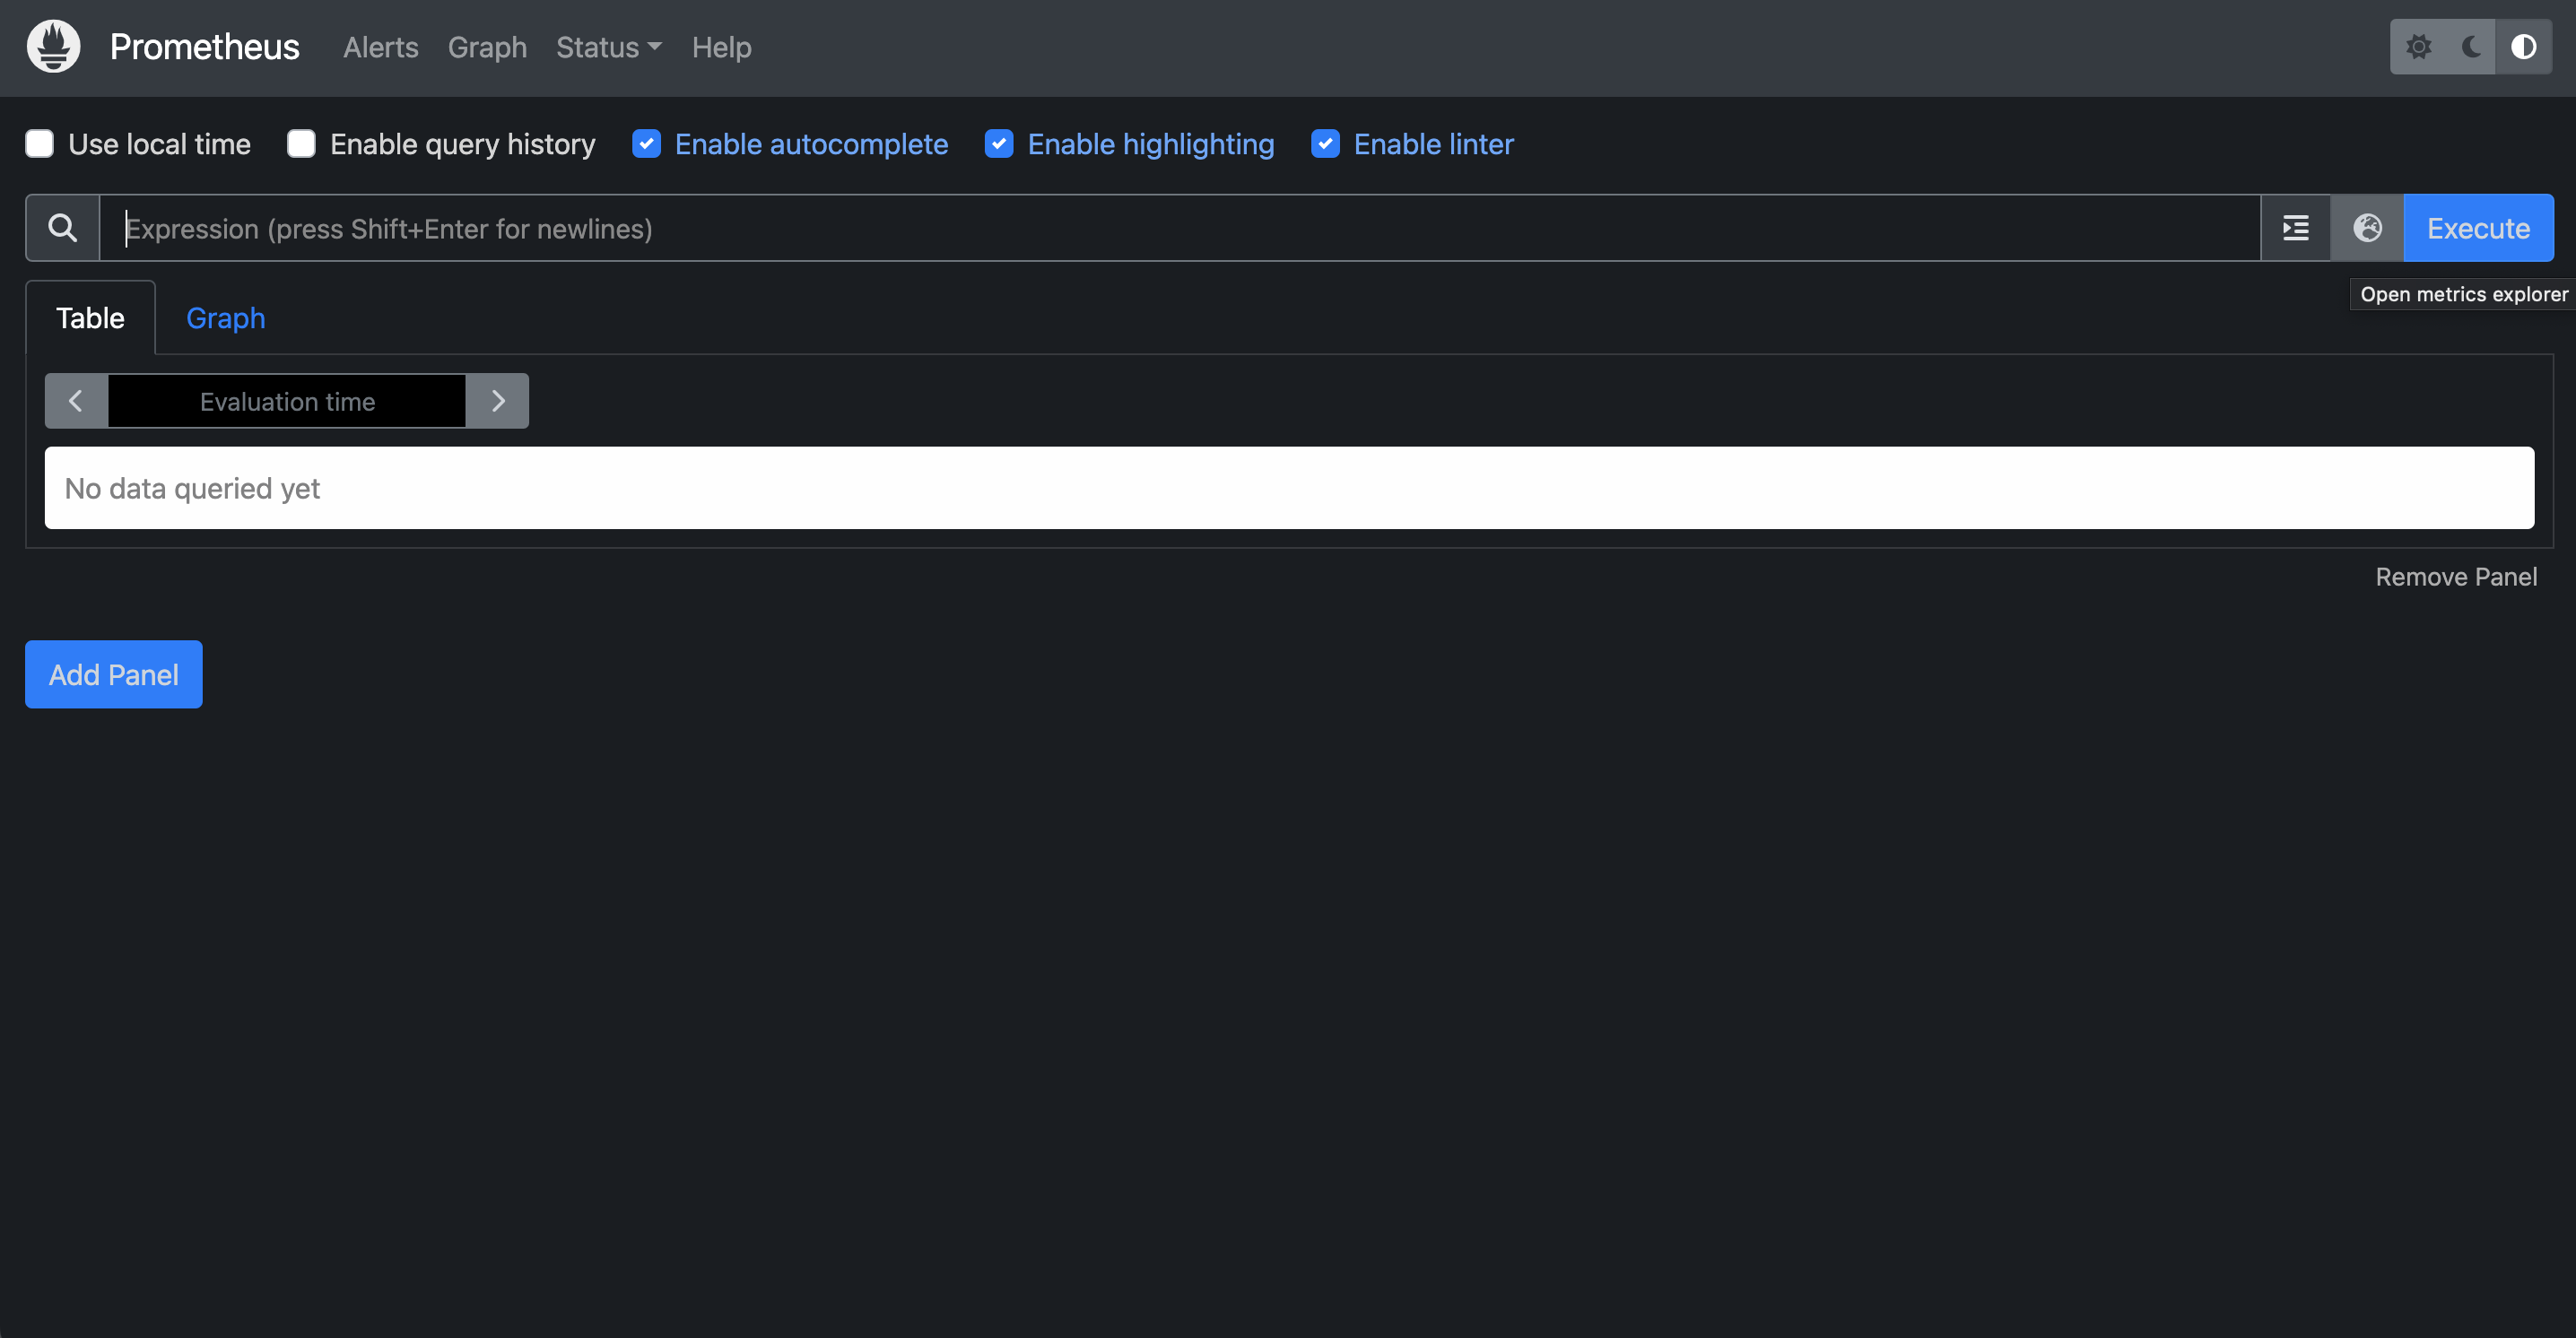
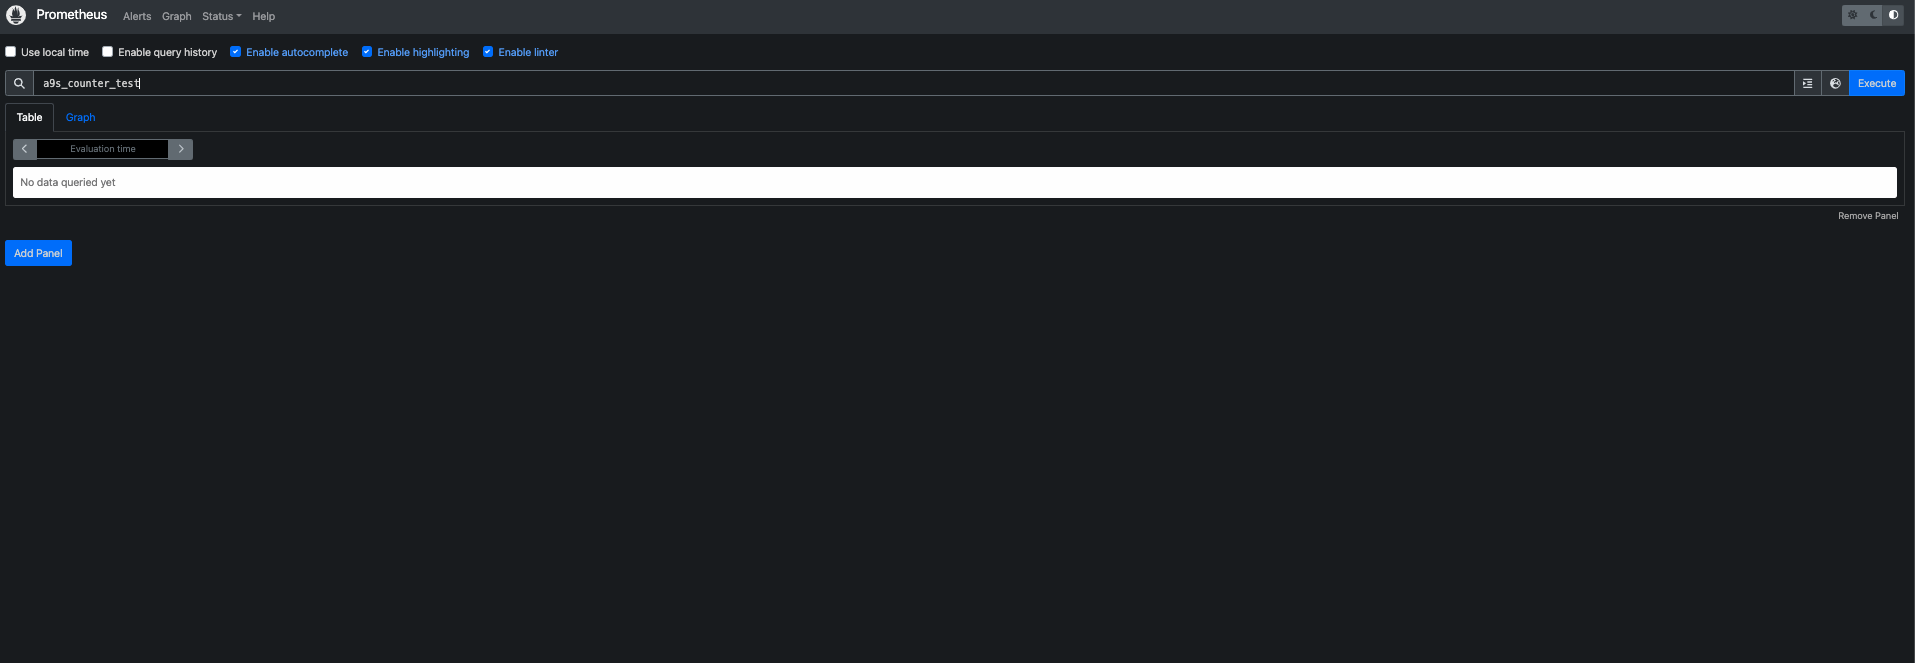
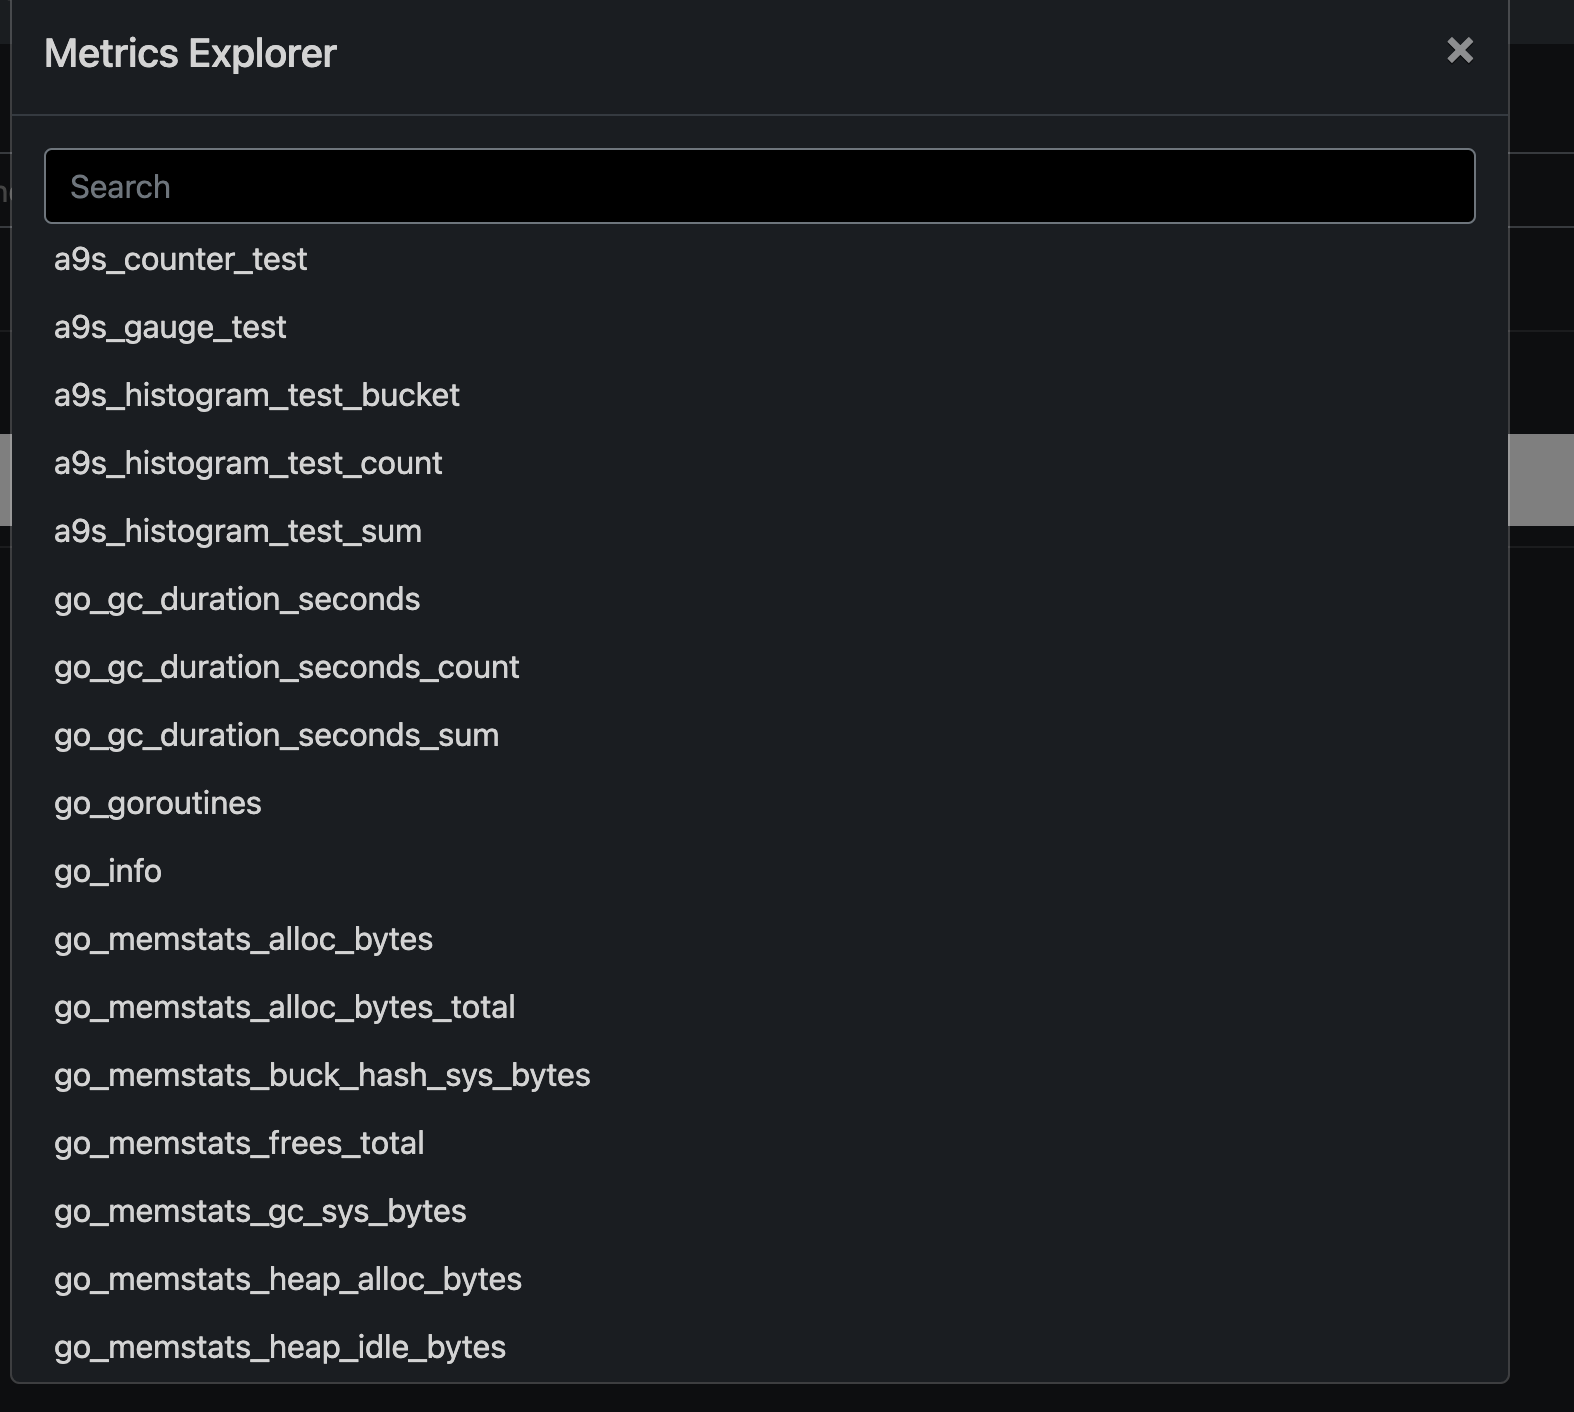
Here you can query a specific metric, or select one from the Metrics Explorer:
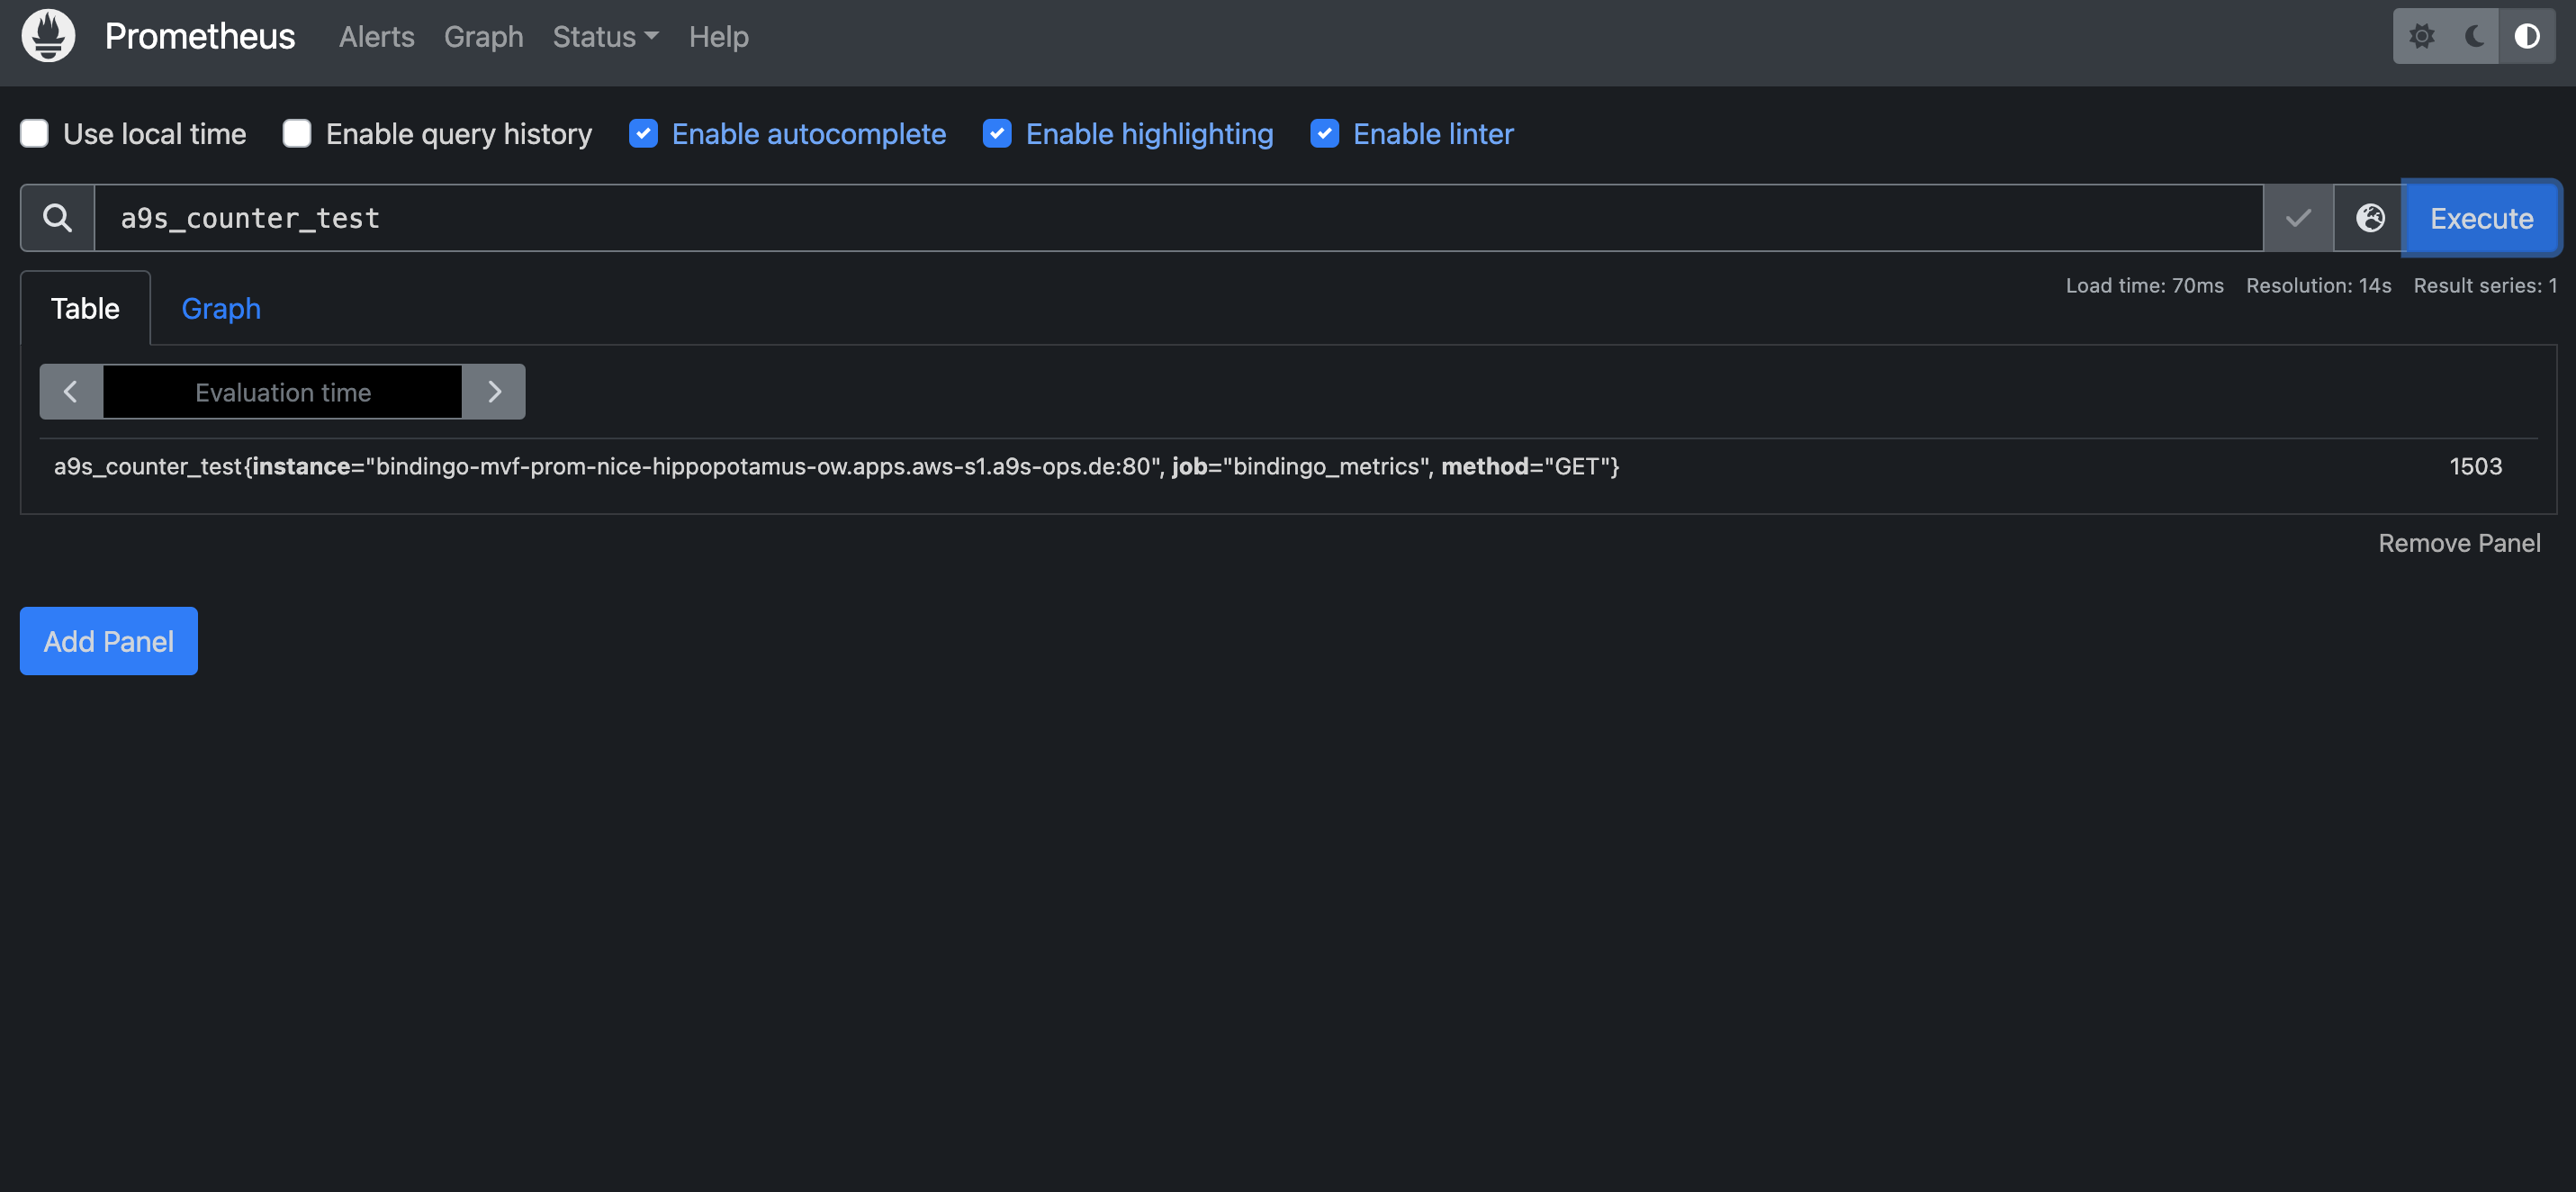
After executing the query you can see both the full query itself (which also shows the job that contains the metric) and its resulting graph:


Alertmanager Dashboard
To access the Alertmanager dashboard, you have to append alertmanager to the URL:
https://a9s-dashboard.system.a9s-ds-concourse.a9s-ops.de/service-instances/2fe38eeb-e3a0-4d18-86bc-1c0c0b0e303f/alertmanager
Delete an a9s Prometheus Service Instance
This operation cannot be undone and all the data is lost when the Service Instance is deleted.
Before you can delete a Service Instance, you must unbind it from all apps and delete all service keys.
List Bound Applications
Run cf services to list your available services and the bound application to them.
$ cf services

Getting services in org test / space test as admin...

name                    service          plan                      bound apps           last operation
my-prometheus-service   a9s-prometheus   prometheus-single-small   a9s-prometheus-app   create succeeded
This example shows that my-prometheus-service is bound to the a9s-prometheus-app app.
Unbind a Service Instance
Run cf unbind to unbind the service from your app.
cf unbind-service a9s-prometheus-app my-prometheus-service
List Service Keys
Run cf service-keys my-prometheus-service to list the service keys created for your Service Instance.
$ cf service-keys my-prometheus-service

Getting keys for service instance my-prometheus-service as admin...

name
my-service-key
This example shows that my-prometheus-service has one service key my-service-key.
Delete a Service Key
Run cf delete-service-key my-prometheus-service my-service-key to delete the service key.
$ cf delete-service-key my-prometheus-service my-service-key

Deleting key my-service-key for service instance my-prometheus-service as admin...
OK
Delete a Service Instance
After unbinding the Service Instance from the bound applications and deleting the related service key, it can now be
deleted. Run cf delete-service to delete the Service Instance:
cf delete-service my-prometheus-service
It may take several minutes to delete the Service Instance. Deleting a Service Instance deprovisions the corresponding
infrastructure resources.
Run the cf services command to view the deletion status.
Upgrade the Service Instance to another Service Plan
You can update the service plan of your Service Instance by executing the following command:
cf update-service my-prometheus-service -p a-similar-newer-plan
a9s Prometheus does NOT support Service Instance upgrades from Service Instances containing Grafana 5 to any other type of a9s Prometheus Service Instance.
Cloud Foundry Application Security Groups
This topic describes how to check whether an Application Security Group (ASG) was created.
Each a9s Data Service will automatically create and update Cloud Foundry ASGs in order to protect Service Instances to be accessed by applications not running in the same Cloud Foundry applications space. For further details on Security Groups you can refer to the Understanding Application Security Groups page in the official Cloud Foundry documentation.
Get Service Instance GUID
Run cf service INSTANCE_NAME --guid to get the guid of the Service Instance.
$ cf service my-prometheus-service --guid
2fe38eeb-e3a0-4d18-86bc-1c0c0b0e303f
Check available Security Groups
To see all available security groups use cf security-groups.
$ cf security-groups
Getting security groups as admin
OK

     name                                           organization     space  lifecycle
#0   public_networks
#1   dns
#3   a9s-asg-432fb752-876d-443b-a311-a075f4df2237   demonstrations   demo   running
     a9s-asg-432fb752-876d-443b-a311-a075f4df2237   demonstrations   demo   staging
#4   a9s-asg-2fe38eeb-e3a0-4d18-86bc-1c0c0b0e303f   demonstrations   demo   running
     a9s-asg-2fe38eeb-e3a0-4d18-86bc-1c0c0b0e303f   demonstrations   demo   staging
There we can see a security group named a9s-asg-2fe38eeb-e3a0-4d18-86bc-1c0c0b0e303f was successfully created.
In some circumstances it is not possible to bind/connect the application and the a9s Prometheus Service Instance, in such cases you must verify if a security group was created.
Make a Service Instance Locally Available
It is possible to access any of the a9s Data Services locally. That means you can connect with a local client to the Service Instance for any purpose such as debugging. CF provides a smart way to create SSH forward tunnels via a pushed application. For more information about this feature see the Accessing Apps with SSH section of the CF documentation.
First of all you must have an application bound to the Service Instance. You can find a step-by-step guide on how to do this in the Bind an Application to a Service Instance section.
cf ssh support must be enabled in the platform. Ask your administrator if you are not sure.
Get The Service URL and Credentials
Follow the instructions how to Obtain Service Instance Access Credentials and you will get the user credentials and the accessible URLs of your Service Instance.
$ cf env a9s-prometheus-app
Getting env variables for app a9s-prometheus-app in org test / space test as admin...
OK

System-Provided:
{
  "VCAP_SERVICES": {
   "a9s-prometheus": [
    {
      "credentials": {
       "alertmanager_urls": [
          "http://d37f7da-alertmanager-0.node.dc1.consul:9093/service-instances/2fe38eeb-e3a0-4d18-86bc-1c0c0b0e303f/alertmanager"
        ],
        "grafana_urls": [
          "http://d37f7da-grafana-0.node.dc1.consul:3000/service-instances/2fe38eeb-e3a0-4d18-86bc-1c0c0b0e303f/grafana"
        ],
        "graphite_exporter_port": 9109,
        "graphite_exporters": [
          "d37f7da-prometheus-0.node.dc1.consul"
        ],
        "password": "a9s-password",
        "prometheus_urls": [
          "http://d37f7da-prometheus-0.node.dc1.consul:9090/service-instances/2fe38eeb-e3a0-4d18-86bc-1c0c0b0e303f/prometheus"
        ],
        "username": "a9s-brk-usr"
     },
     "label": "a9s-prometheus",
     "name": "my-prometheus-service",
     "plan": "prometheus-single-small"
    }
   ]
  }
}
...
Notice the URLs alertmanager_urls, grafana_urls and prometheus_urls, the username a9s-brk-usr and the password
a9s-password. You will need these URLS and credentials in the next step.
Create a Tunnel to The Service Instance
With the cf ssh, as mentioned before, you can create a ssh forward tunnel to your Service Instance. To connect to the
Prometheus API you have to execute the following command:
$ cf ssh a9s-prometheus-app -L 9090:d37f7da-prometheus-0.node.dc1.consul:9090
vcap@956aaf4e-6da9-4f69-4b1d-8e631a403312:~$
Once the SSH tunnel is open you can access the Prometheus API via your browser or the use of cURL through the URL
localhost:9090/service-instances/2fe38eeb-e3a0-4d18-86bc-1c0c0b0e303f/prometheus, this will require you to provide the
above mentioned credentials.
You can access both the Grafana API and the Alertmanager API of your Service Instance in a similar manner.
Don't forget to close the session with exit.
a9s Prometheus Custom Parameters
As an Application Developer you have the opportunity to customize your Service Instance by using custom parameters.
Custom parameters are passed on to a Service Instance by using the -c switch of the cf CLI commands
cf create-service and cf update-service.
For example,
cf update-service my-prometheus-service -c '{ "my_custom_parameter": "value" }'
would set the custom parameter named my_custom_parameter to the value value for the Service Instance
my-prometheus-service.
You don't have to utilize those settings. There are sane defaults in place that fit your service plan well.
mapping_strict_match
This property is used to configure the setting mapping-strict-match of the
Graphite exporter. The default value is true.
If mapping_strict_match is set to true, only the metrics specified in the Graphite mapping configuration are
allowed. Thus metrics that don't match the mapping configuration are skipped. This is useful if you have a very large
set of metrics. For more information please see the Graphite Documentation.
scrape_configs
This custom parameter is disabled by default. Please contact your Platform Operator for further details.
The scrape_configs parameter allows the Application Developer to configure scraping targets for your a9s Prometheus
Service Instance in the form of a valid JSON object.
Please keep in mind that while scraping targets can be set, the default targets are always set and take precedence over the ones provided by the custom parameter.
The example below showcases the minimum configuration required in order to properly set a scraping target. For a comprehensive list of accepted parameters please refer to the Prometheus documentation:
{
  "scrape_configs": [
    {
      "job_name": "example_metrics",
      "scrape_interval": "60s",
      "scrape_timeout": "30s",
      "static_configs": [
        {
          "targets": [
            "example-app-prometheus-hungry-hippopotamus-ow.apps.example.a9s-dummy.de"
          ]
        }
      ]
    }
  ]
}
$ cf update-service my-prometheus-service -c custom_scrape_configs.json
While there is a validation in place to ensure that the provided JSON object is valid, it should be noted that the contents themselves are not validated. Thus, it is the responsibility of the Application Developer to properly sanitize and validate this input.