Service Instance Access
This page describes usage specific to a9s Prometheus. It builds upon the information provided in Getting Started - Accessing a Service Instance.
Accessing an a9s Prometheus Service Instance
In order to access an a9s Prometheus Service Instance, the Service Instance's credentials stored in the environment variables of the application bound to it. This is further explanined in Lifecycle of a Service Instance - Obtain Credentials for Accessing a Service Instance.
cf env a9s-prometheus-app
Output
Getting env variables for app a9s-prometheus-app in org test / space test as admin...
OK

System-Provided:
{
 "VCAP_SERVICES": {
  "a9s-prometheus": [
   {
    "credentials": {
     "alertmanager_urls": [
      "EXAMPLE_ALERTMANAGER_URL"
     ],
     "grafana_urls": [
      "EXAMPLE_GRAFANA_URL"
     ],
     "graphite_exporter_port": 9109,
     "graphite_exporters": [
      "EXAMPLE_GRAPHITE_URL"
     ],
     "password": "EXAMPLE-PASSWORD",
     "prometheus_urls": [
      "EXAMPLE_PROMETHEUS_URL"
     ],
     "username": "EXAMPLE-USERNAME"
    },
    "label": "a9s-prometheus",
    "name": "my-prometheus-service",
    "plan": "prometheus-single-small",
    "tags": [
     "metrics",
     "logging",
     "alerting",
     "monitoring",
     "prometheus"
    ]
   }
  ]
 }
}
...
The alertmanager_urls, grafana_urls, prometheus_urls, username and password values can be used to connect to
the different APIs within the application.
Create a Tunnel to The Service Instance
With the cf ssh command a ssh forward tunnel to the Service Instance can be created. Use port 9090 to connect to the
a9s Prometheus Instance.
cf ssh a9s-prometheus-app -L 9090:d37f7da-prometheus-0.node.dc1.consul:9090
vcap@956aaf4e-6da9-4f69-4b1d-8e631a403312:~$
Once the SSH tunnel is open you can access the Prometheus API via your browser or the use of cURL through the URL
localhost:9090/service-instances/2fe38eeb-e3a0-4d18-86bc-1c0c0b0e303f/prometheus, this will require you to provide the
above mentioned credentials.
You can access both the Grafana API and the Alertmanager API of your Service Instance in a similar manner.
Don't forget to close the session with exit.
Stream a9s Service Instance Metrics to a9s Prometheus
To use an a9s Prometheus Service Instance to monitor another a9s Service Instance, the fields graphite_exporters and graphite_exporters_port which will have to be fetched from a service key.
cf service-key my-prometheus-service my-service-key
Output
Getting key my-service-key for service instance my-prometheus-service as admin...

{
 "alertmanager_urls": [
  "http://d00a2c-alertmanager-0.node.dc1.consul:9093/service-instances/2fe38eeb-e3a0-4d18-86bc-1c0c0b0e303f/alertmanager/"
 ],
 "grafana_urls": [
  "http://d00a2c-grafana-0.node.dc1.consul:3000/service-instances/2fe38eeb-e3a0-4d18-86bc-1c0c0b0e303f/grafana/"
 ],
 "graphite_exporter_port": 9109,
 "graphite_exporters": [
  "d00a2c-prometheus-0.node.dc1.consul"
 ],
 "password": "a9s70e5d011f061afff3e4af8073aad09d3a058511a",
 "prometheus_urls": [
  "http://d00a2c-prometheus-0.node.dc1.consul:9090/service-instances/2fe38eeb-e3a0-4d18-86bc-1c0c0b0e303f/prometheus/"
 ],
 "username": "a9s-brk-usr-1f4553994f7a617f23ed4efa629ea7199e2a44d0"
}
Update a a9s Service Instance
The cf update-service command used with the -c flag
can let you stream your metrics to a third-party service. In this case, the command expects a JSON string containing the
graphite key. This key contains the combination of the host and port where the Graphite metrics should be sent to.
You can retrieve this information from the previously created service key of your a9s Prometheus Service Instance, you
need the values from the fields graphite_exporters and graphite_exporters_port.
cf update-service service-instance-to-monitor -c '{"graphite": ["d00a2c-prometheus-0.node.dc1.consul:9109"]}'
For more a9s Data Service specific information, like the available metrics, metrics frequency, etc., see the following pages:
See the a9s Service Instance Metrics
Once your monitored Service Instance is streaming into your a9s Prometheus you can use the Prometheus Dashboard to see the streamed metrics.
Stop Streaming a9s Service Instance Metrics
Follow the steps below to stop streaming Service Instance metrics to a9s Prometheus.
Overwrite Your Service Instance Configuration
If you want to stop streaming your Service Instance metrics to your a9s Prometheus Service Instance, you can overwrite
the graphite key of your Service Instance configuration.
Run cf update-service INSTANCE-NAME -c PARAMETERS-AS-JSON to update the Graphite endpoint of the Service Instance you
don't want to monitor anymore. For this, you need to overwrite the value of the graphite key with an empty array.
cf update-service service-instance-to-monitor -c '{"graphite": []}'
Stream Application Metrics to a9s Prometheus
Prometheus is designed to aggregate scraped data from various targets into its time series database. So, it can be as simple as implementing a metrics endpoint and allowing Prometheus to query that endpoint.
Due to network restrictions depending on the cloud environment, scraping targets can't be used easily. Therefore we will have a look at different options to stream your application metrics to an a9s Prometheus Service Instance.
Using a Custom Scrape Target
If your application implements a metrics endpoint and there are no network restrictions in your cloud environment, you can configure your application as a scrape target in your a9s Prometheus Service Instance. For more information see Scrape Configs.
Using the Graphite Exporter
a9s Prometheus contains a Graphite Exporter endpoint to which you can stream metrics. By default, the Graphite Exporter has rules defined to map Graphite compliant metrics to Prometheus compliant metrics with labels.
Additionally, via the strict matching settings, the Graphite Exporter filters metrics which don't match these rules. In order to allow the a9s Prometheus Service Instance to receive metrics other than the configured ones, you have to switch off the strict matching settings. For more information see here.
Using a Sidecar
Instead of using the Graphite Exporter directly in your application, you can also use a Sidecar that scrapes the metrics endpoint of your application and streams them to the Graphite Exporter. For more information see Using a Sidecar to Collect Application Metrics With a9s Prometheus.
See the Application Metrics
Once your monitored application is streaming into your a9s Prometheus Service Instance you can use the Prometheus Dashboard to see the streamed metrics.
Stop Streaming Application Metrics to a9s Prometheus
Depending on the approach you are using to stream your application metrics to your a9s Prometheus Service Instance, you have to execute different steps.
Stop Using a Custom Scrape Target
If you want to stop your a9s Prometheus Service Instance from scraping your application, you have to update your Service Instance and remove your application as a target from the scrape configs.
cf update-service my-prometheus-service -c '{ "scrape_configs": [] }'
Stop Using the Graphite Exporter
If you want to stop your application from streaming its metrics to your a9s Prometheus Service Instance, you have to
change the configuration of your application and remove both the graphite_exporters endpoint and the
graphite_exporter_port port.
You can also delete the service key that contains the properties and credentials you used in your application.
cf delete-service-key my-prometheus-service my-key
Stop Using a Sidecar
If you are using the Sidecar approach, you have to unbind your application from your a9s Prometheus Service Instance.
cf unbind-service my-app my-prometheus-service
Access the a9s Prometheus Dashboards
You have to execute the following command to get the required information to access the dashboards of your a9s Prometheus Service Instance:
cf service my-prometheus-service
you will get an output similar to this:
Output
Showing info of service my-prometheus-service in org test / space test as admin...

name:             my-prometheus-service
service:          a9s-prometheus
tags:
plan:             single-small
description:      This is a service creating and managing dedicated Prometheus to monitor applications and Service Instances, powered by the anynines Service Framework
documentation:    https://docs.anynines.com
dashboard:        https://a9s-prometheus-dashboard.system.a9s-ds-concourse.a9s-ops.de/service-instances/2fe38eeb-e3a0-4d18-86bc-1c0c0b0e303f
service broker:   prometheus-service-broker

Showing status of last operation from service SERVICE_NAME...

status:    update succeeded
message:
started:   2022-01-20T08:48:11Z
updated:   2022-01-20T08:49:18Z

There are no bound apps for this service.
Clicking on the dashboard URL shown above, you will get to the following landing page which allows you to access any of the three dashboards that come with a9s Prometheus Service Instances, namely Grafana, Alertmanager and the built-in Prometheus dashboard.
Grafana Dashboard
For more information on the usage of the Grafana Dashboard see the Grafana Dashboard page.
Prometheus Dashboard
The Prometheus dashboard allows you to visualize the streamed/scraped metrics.
See the Streamed Metrics
For the following example, we will use an a9s PostgreSQL as the Service Instance to monitor.
Open the Prometheus Dashboard, which should redirect to the
Graphpage: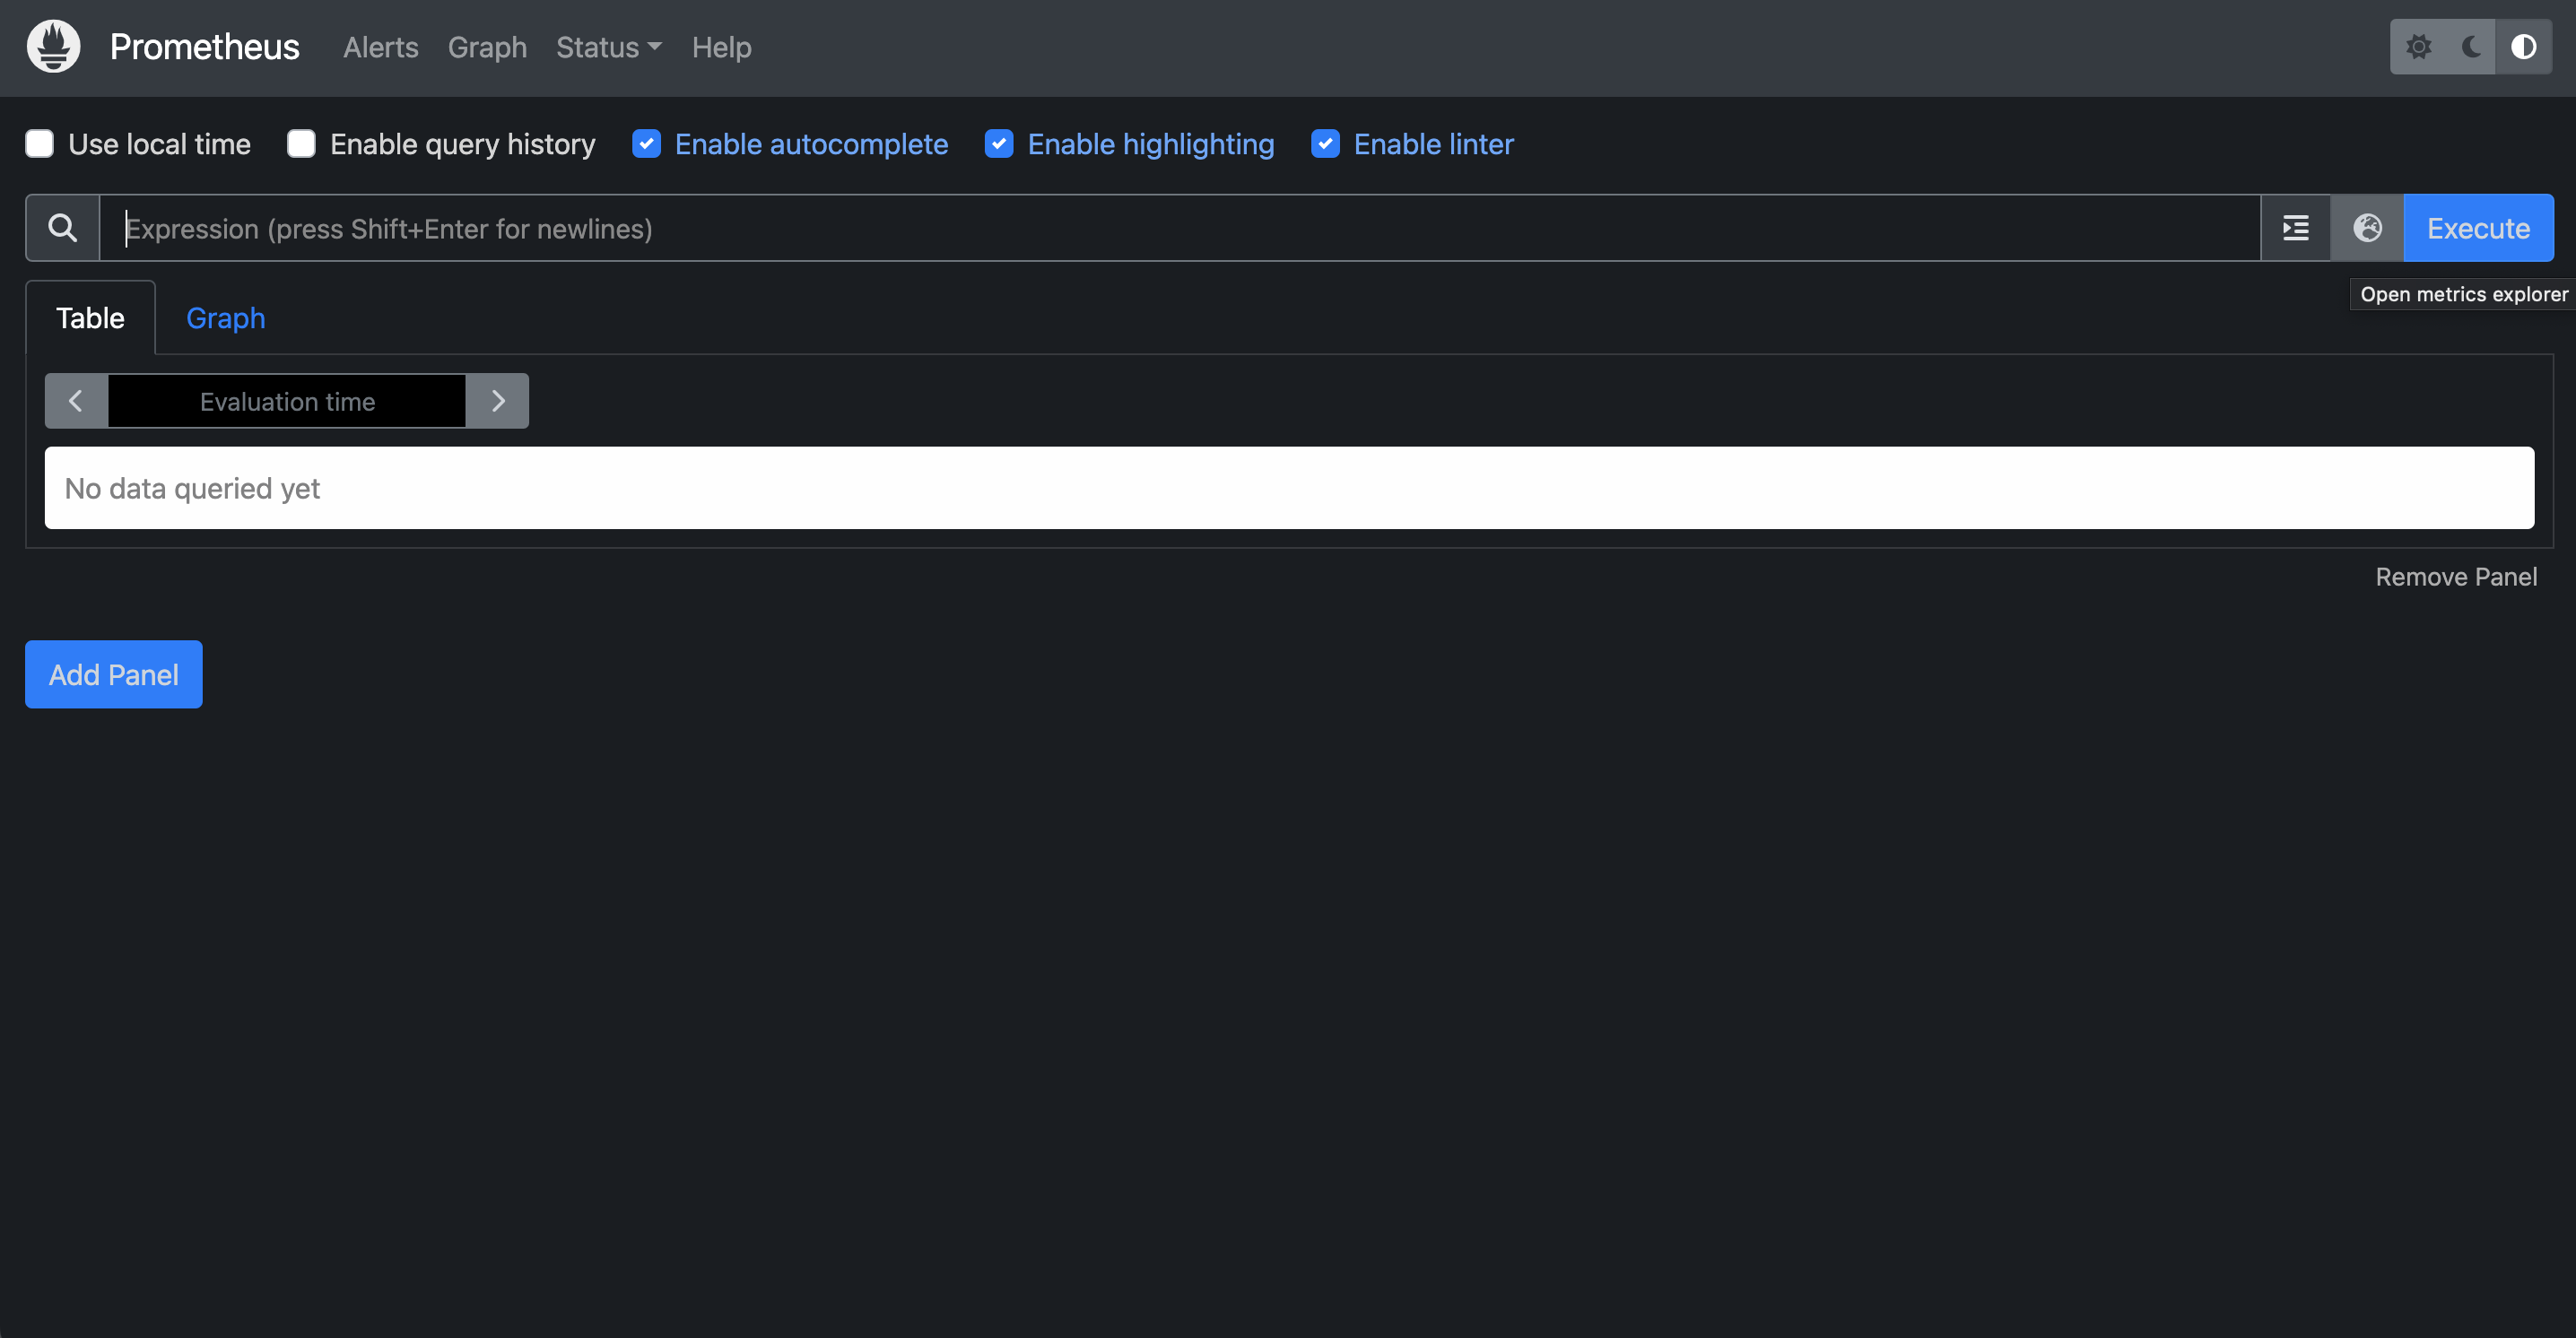
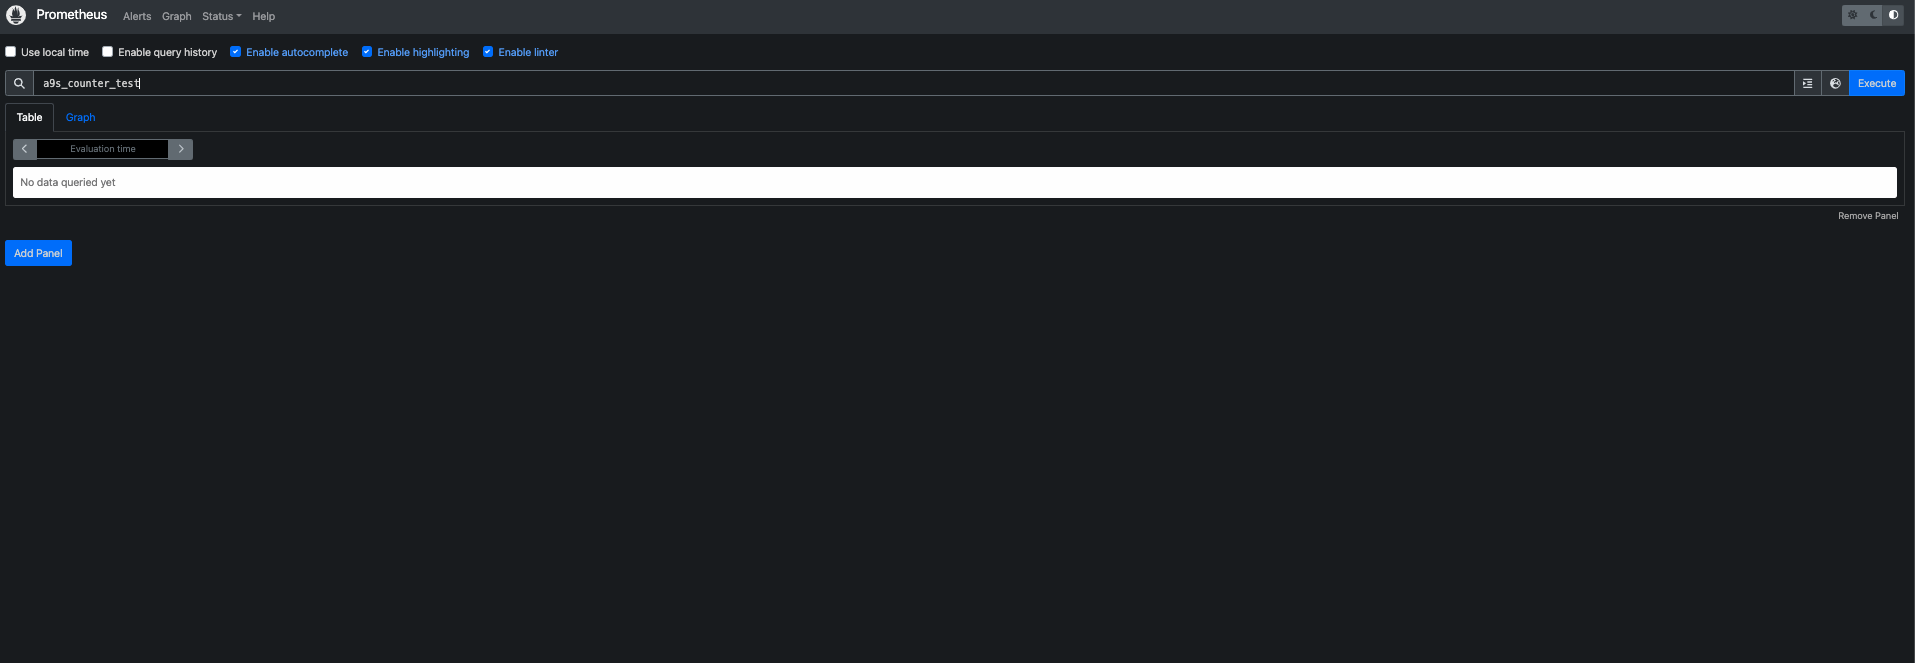
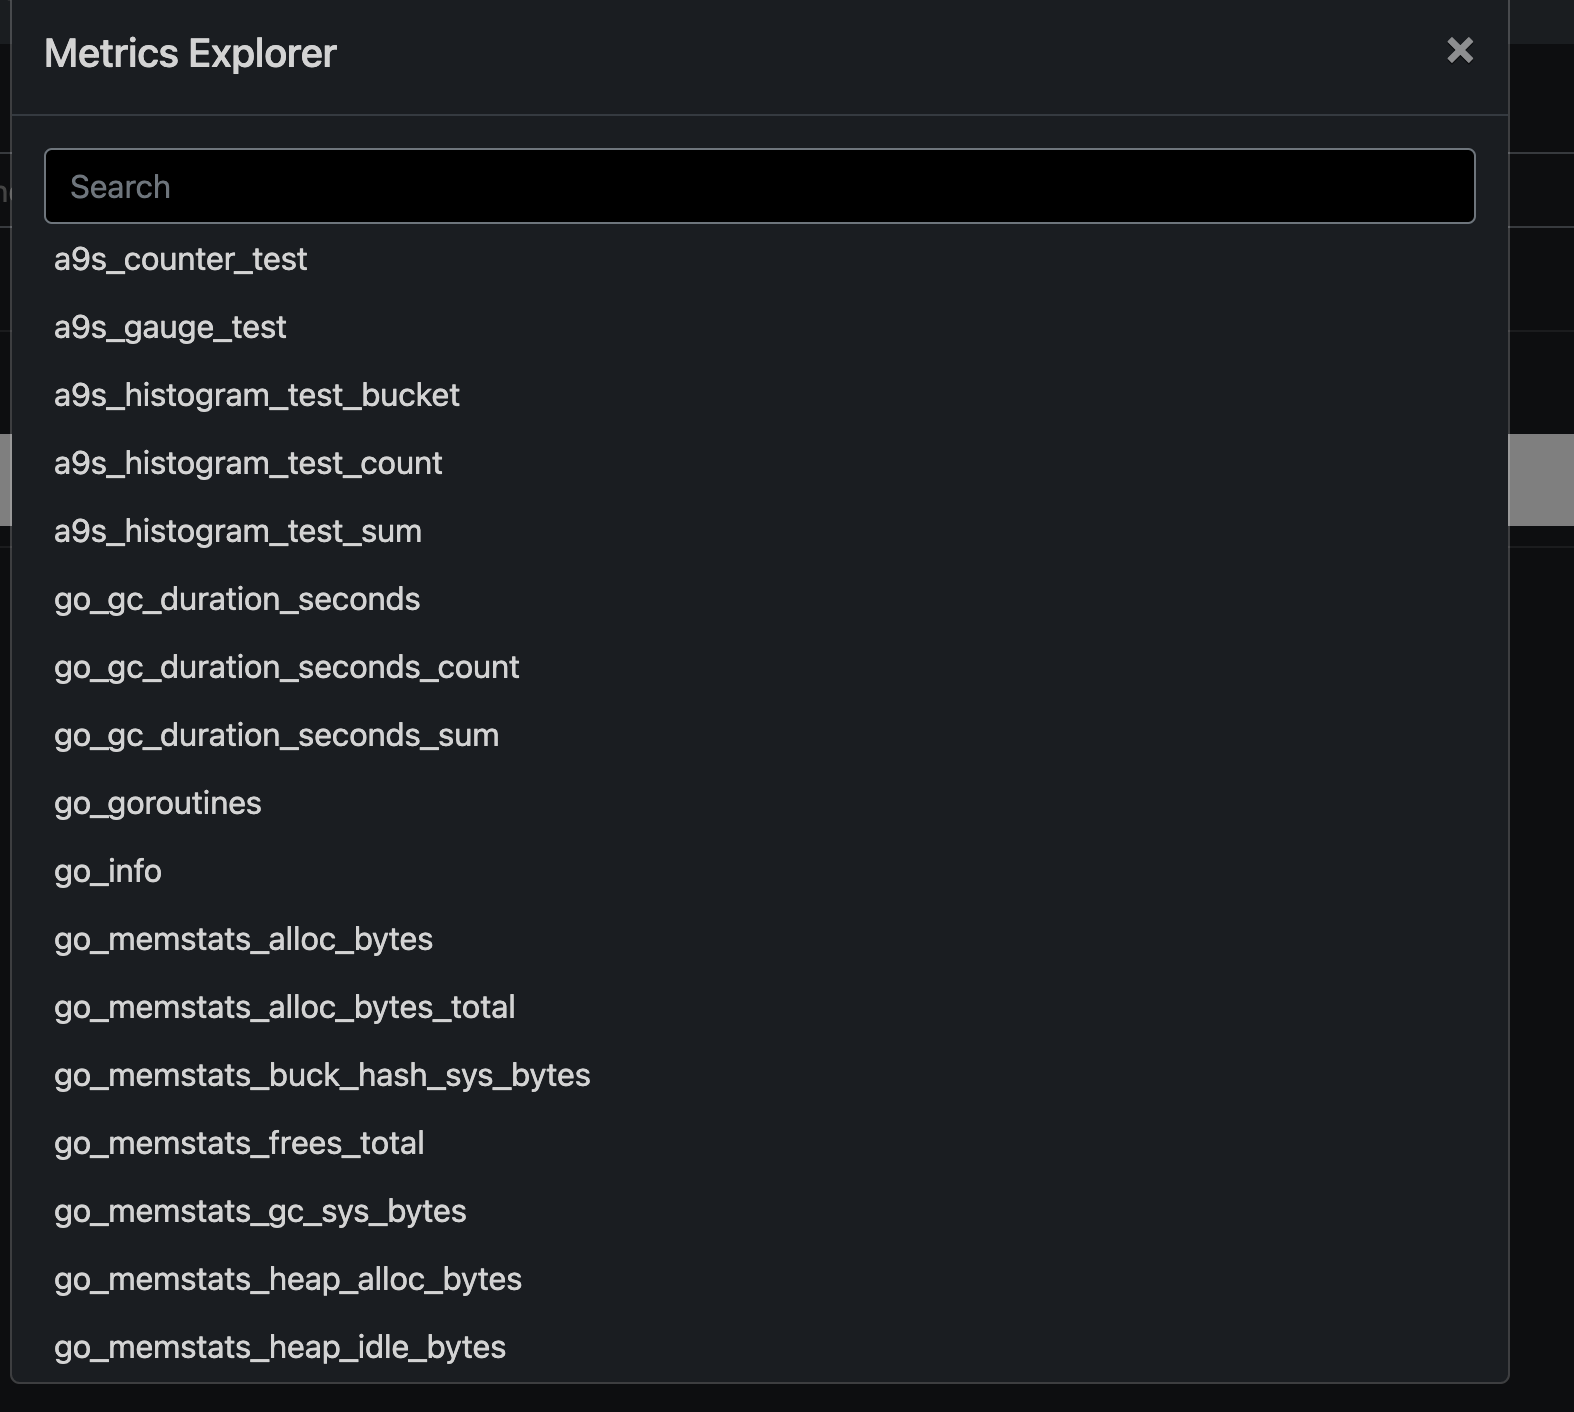
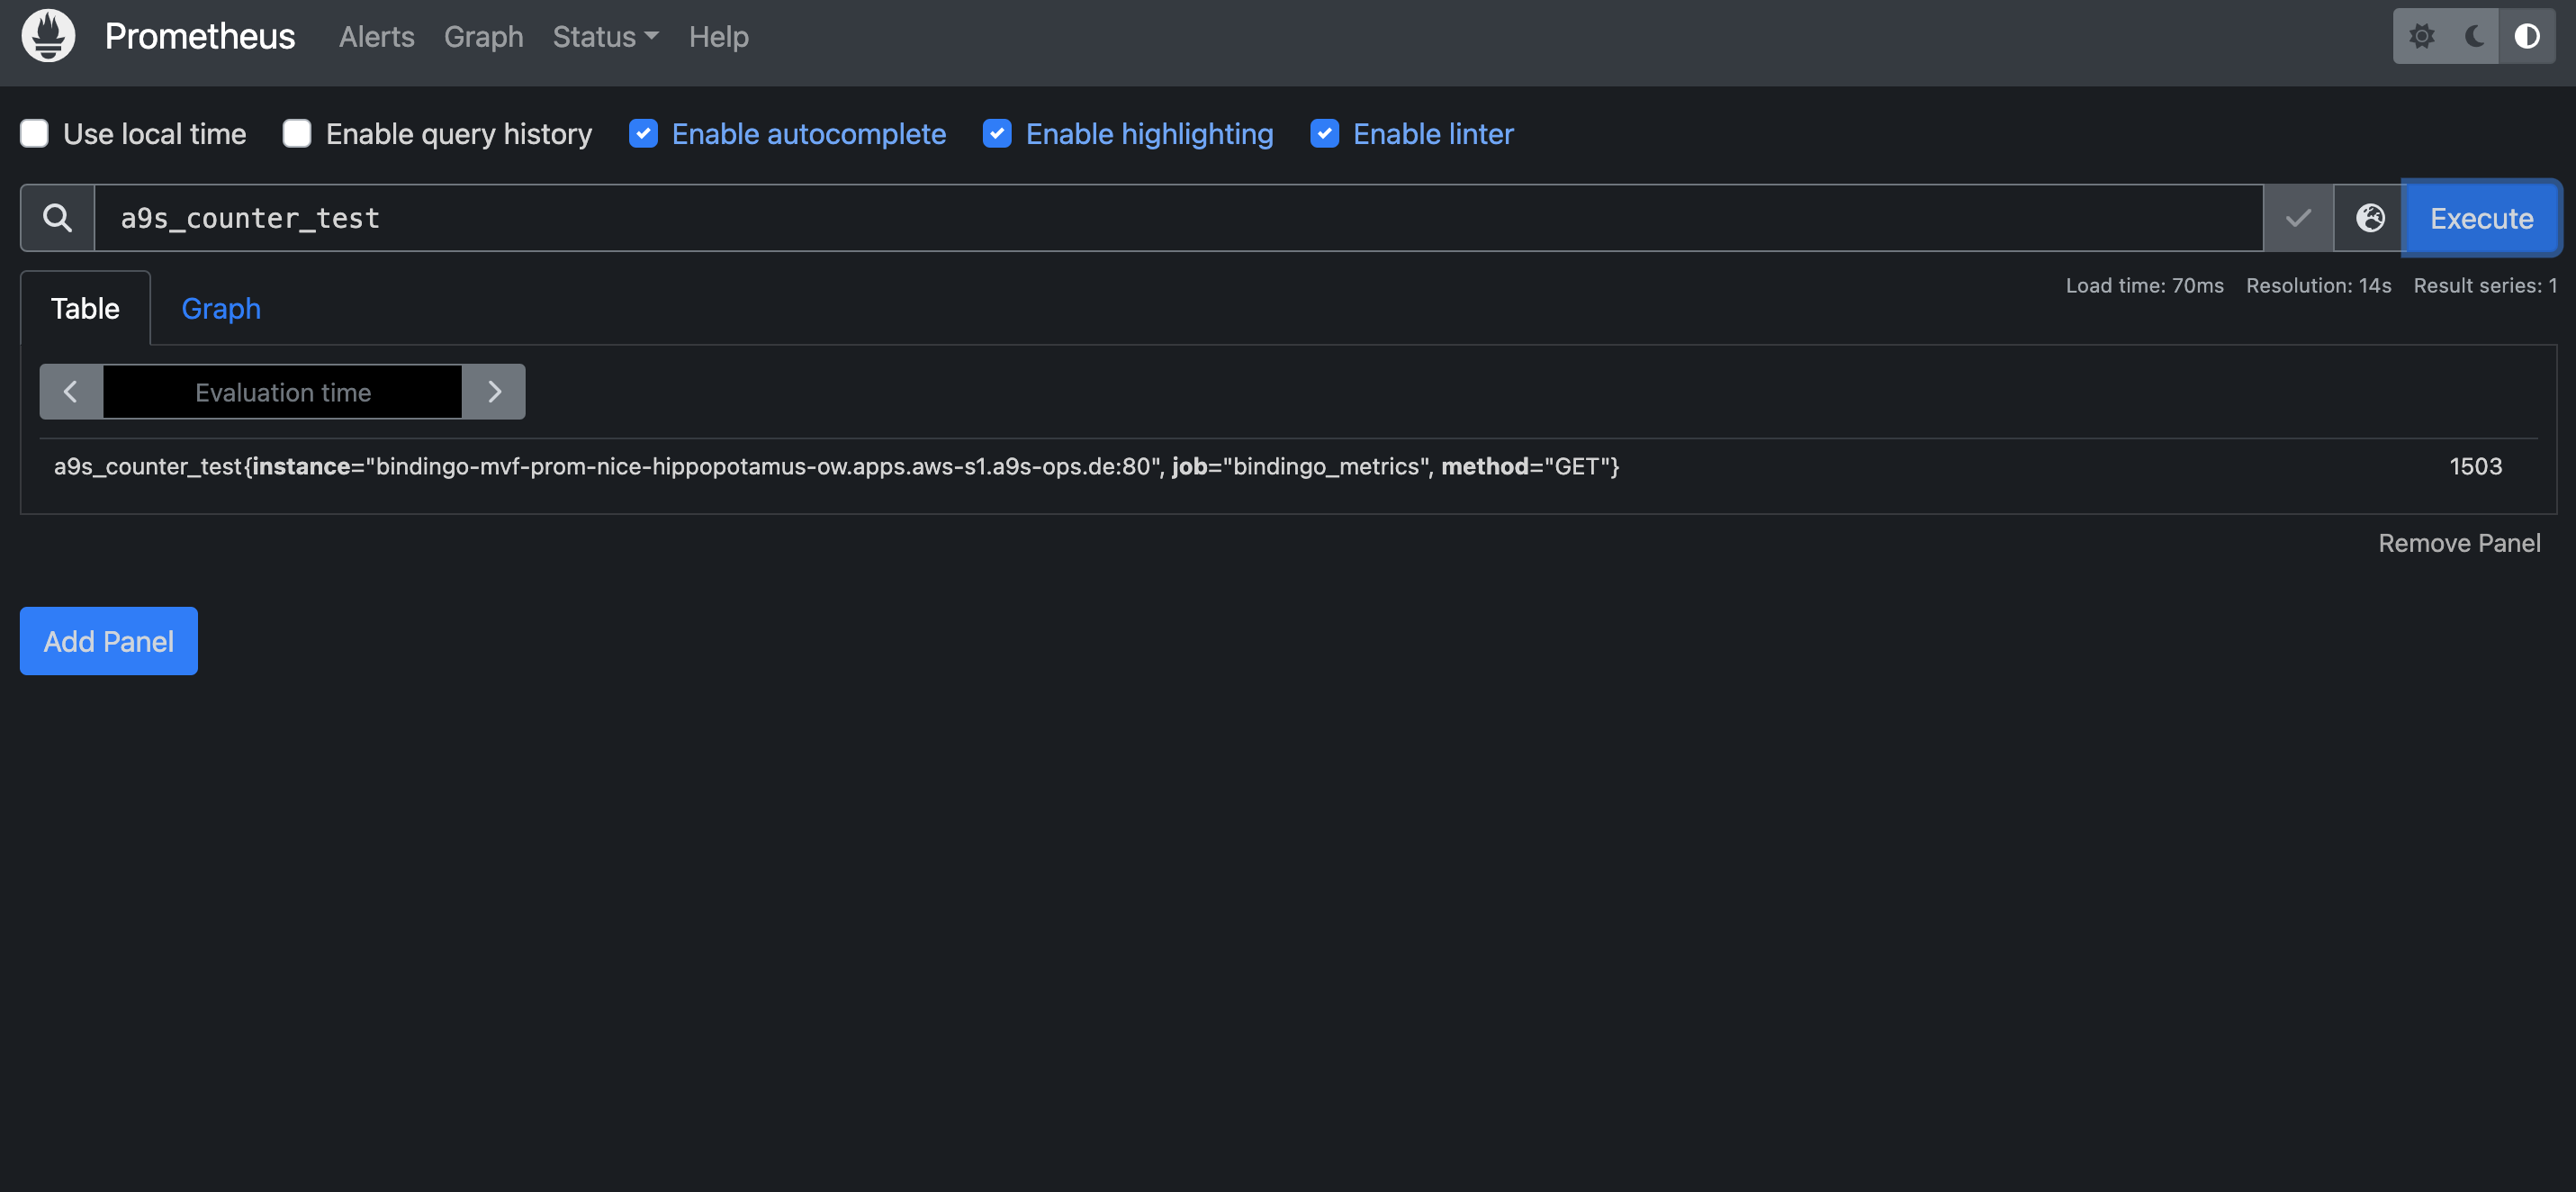
Here you can query a specific metric, or select one from the Metrics Explorer:
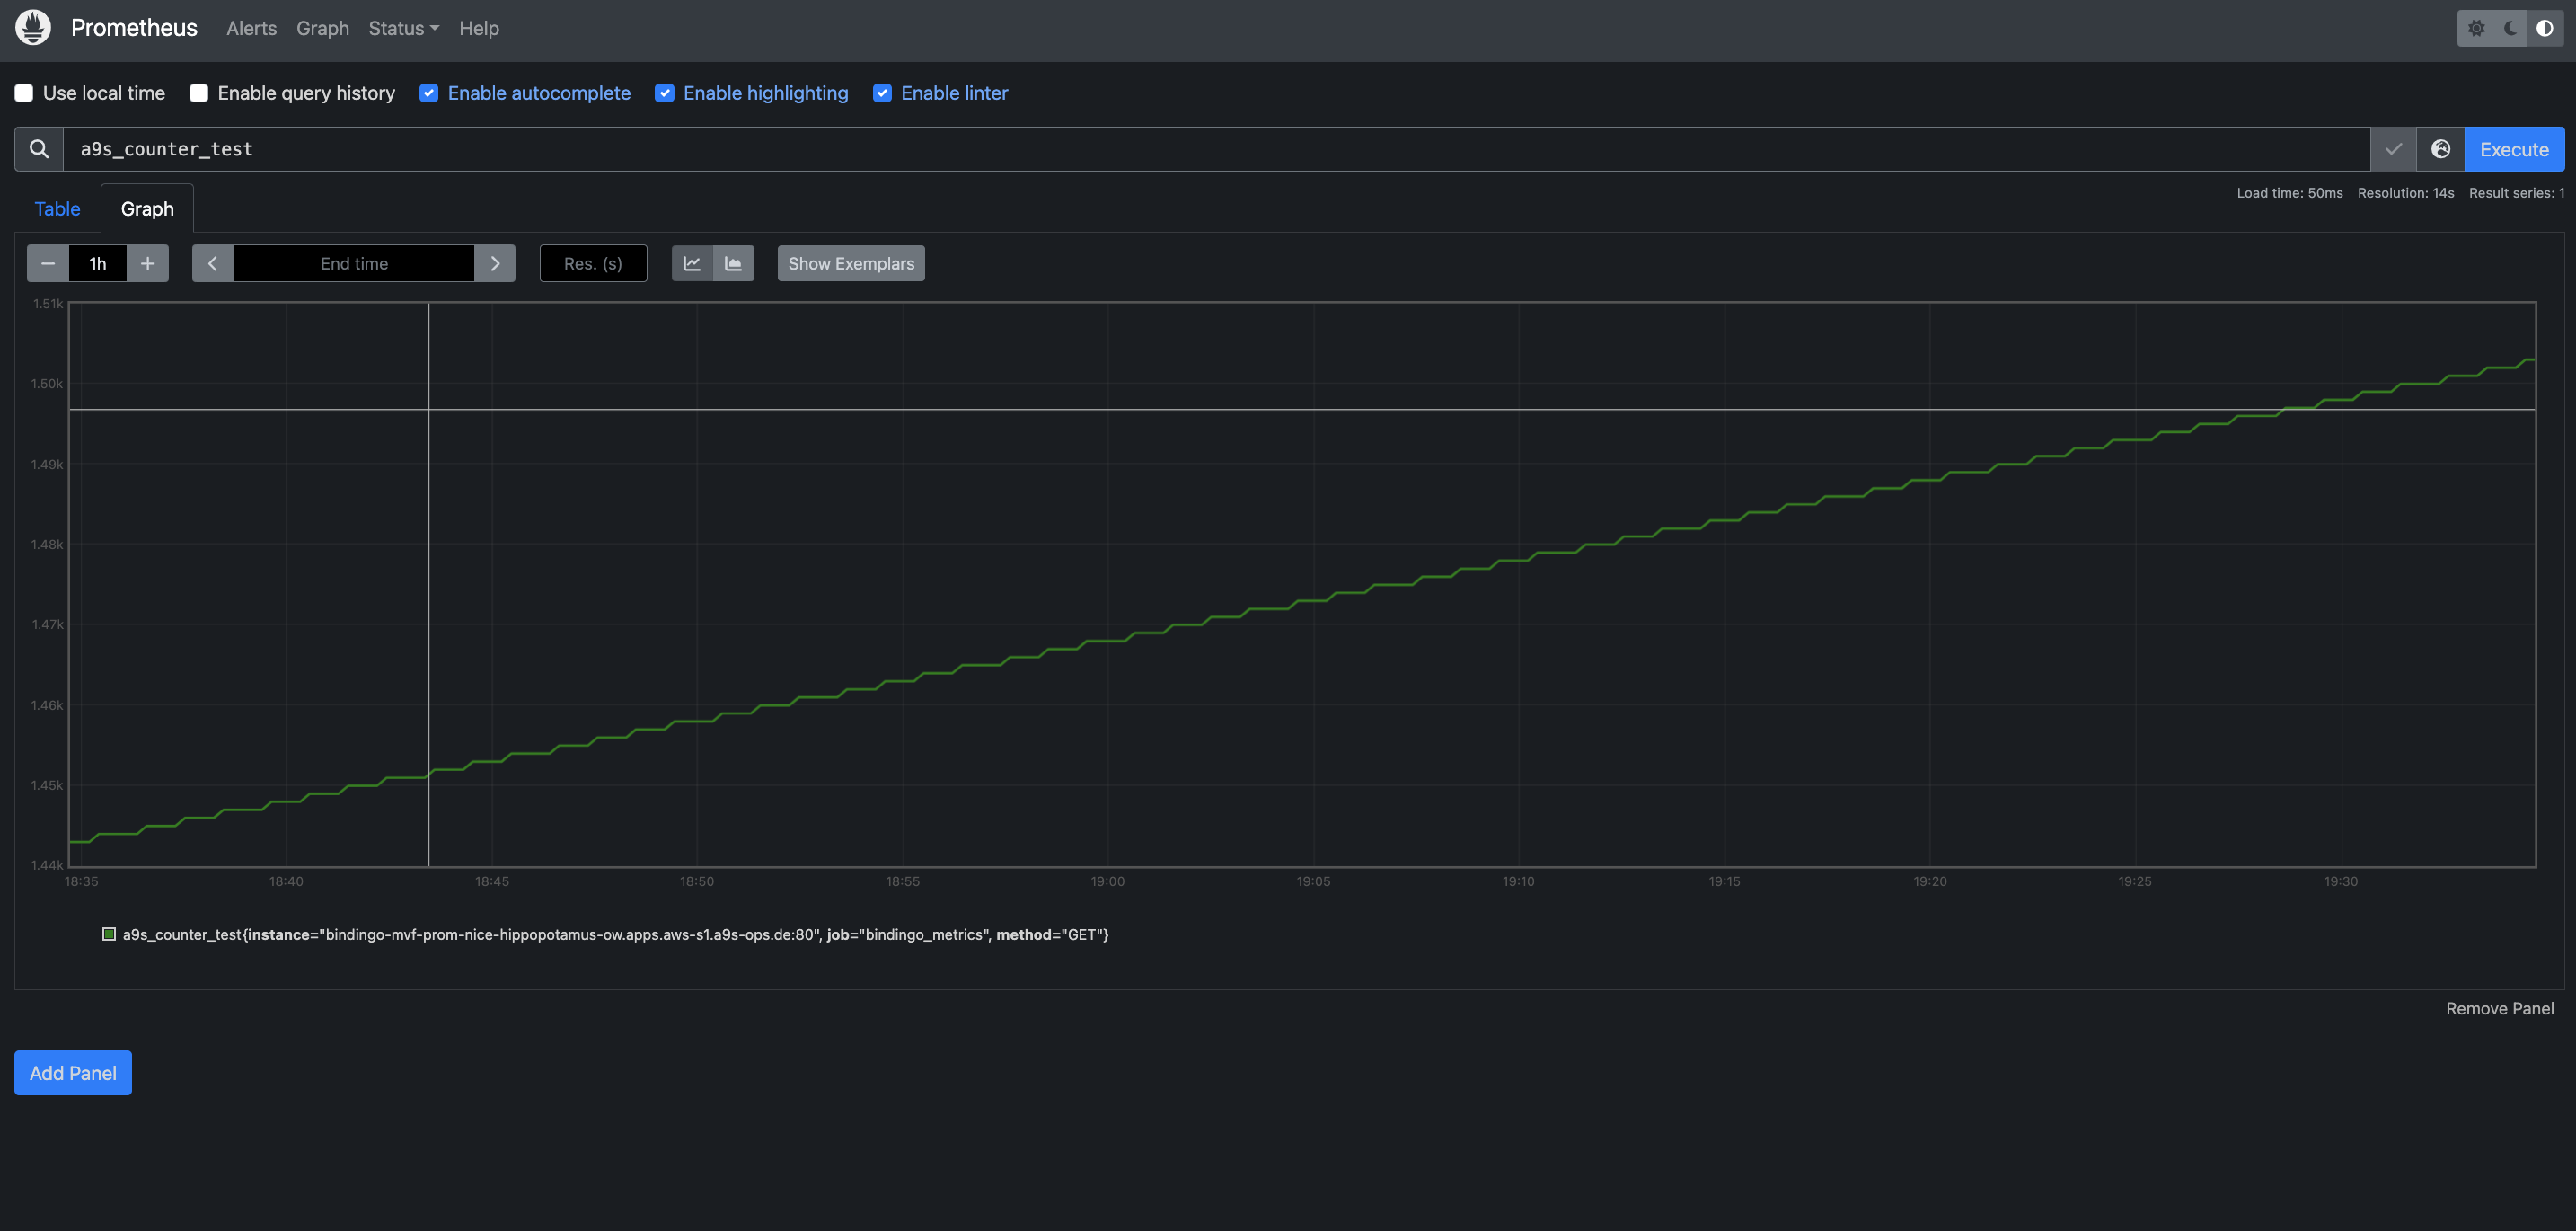
After executing the query you can see both the full query itself (which also shows the job that contains the metric) and its resulting graph:


*Redis is a registered trademark of Redis Ltd. Any rights therein are reserved to Redis Ltd. Any use by anynines GmbH is for referential purposes only and does not indicate any sponsorship, endorsement or affiliation between Redis and anynines GmbH.