Using a Sidecar to Collect Application Metrics With a9s Prometheus
Introduction
Retrieving application metrics is usually not difficult; it can be as simple as implementing a metrics endpoint and allowing Prometheus, for example, to query that endpoint.
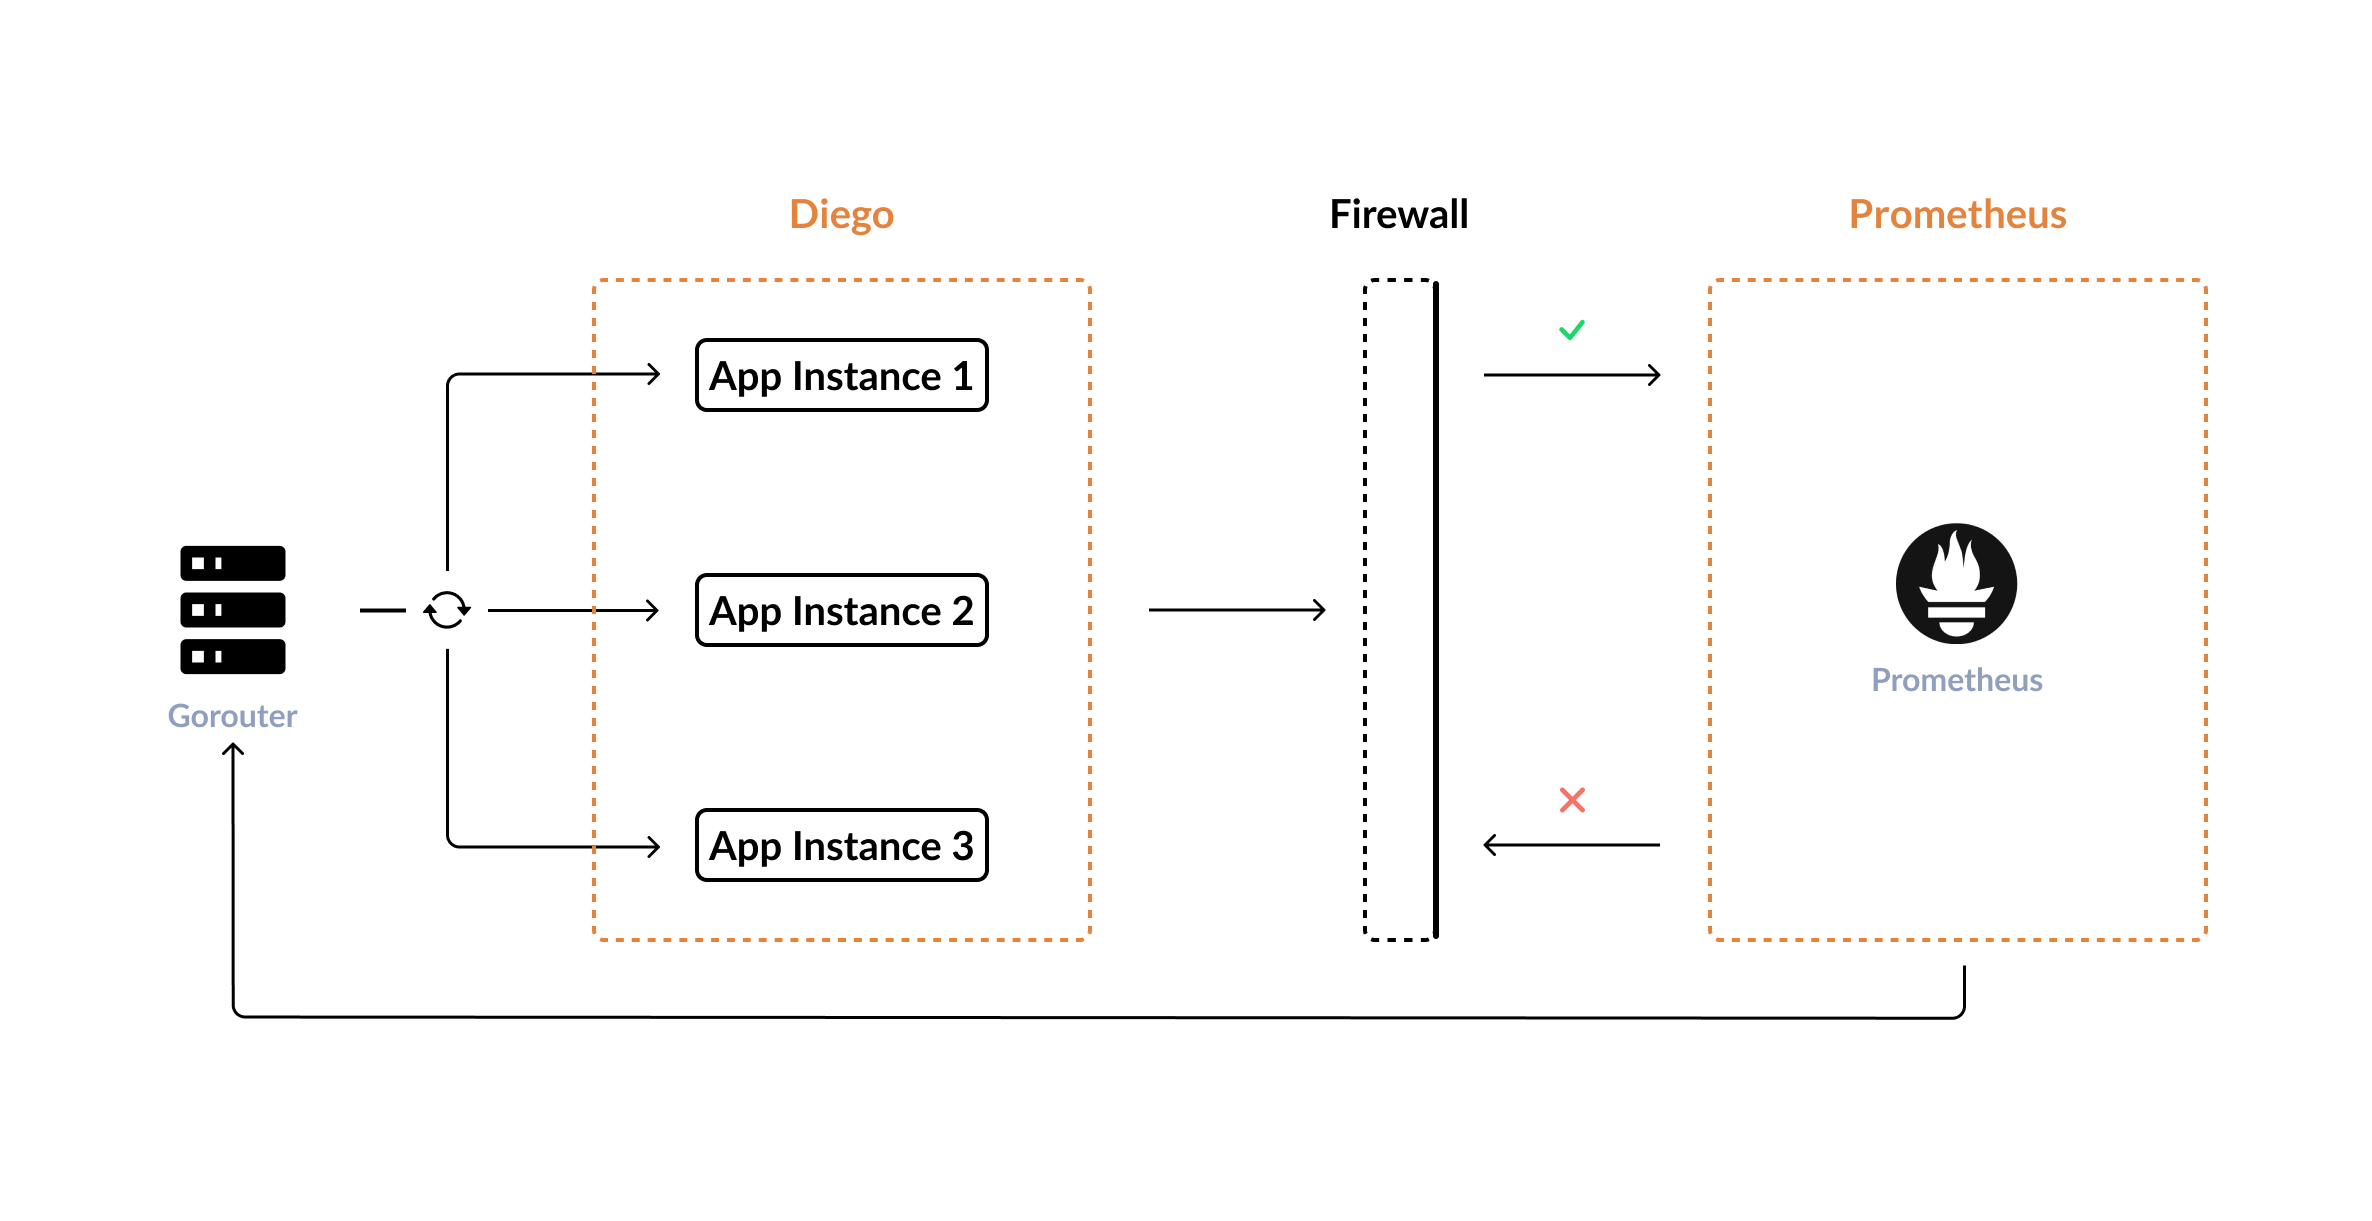
However, once you deploy your application to Cloud Foundry, you will eventually run into problems, one of the most likely scenarios is that the application's endpoint cannot be easily retrieved from a running a9s Prometheus Service Instance, which is to be scraped. In this type of scenario, either the endpoint is not reachable from the network where the a9s Prometheus Service Instance is running, or there are multiple instances of your application running at the same time, so each time Prometheus retrieves the application you are redirected to a different instance via the Gorouter as it acts as a load balancer.
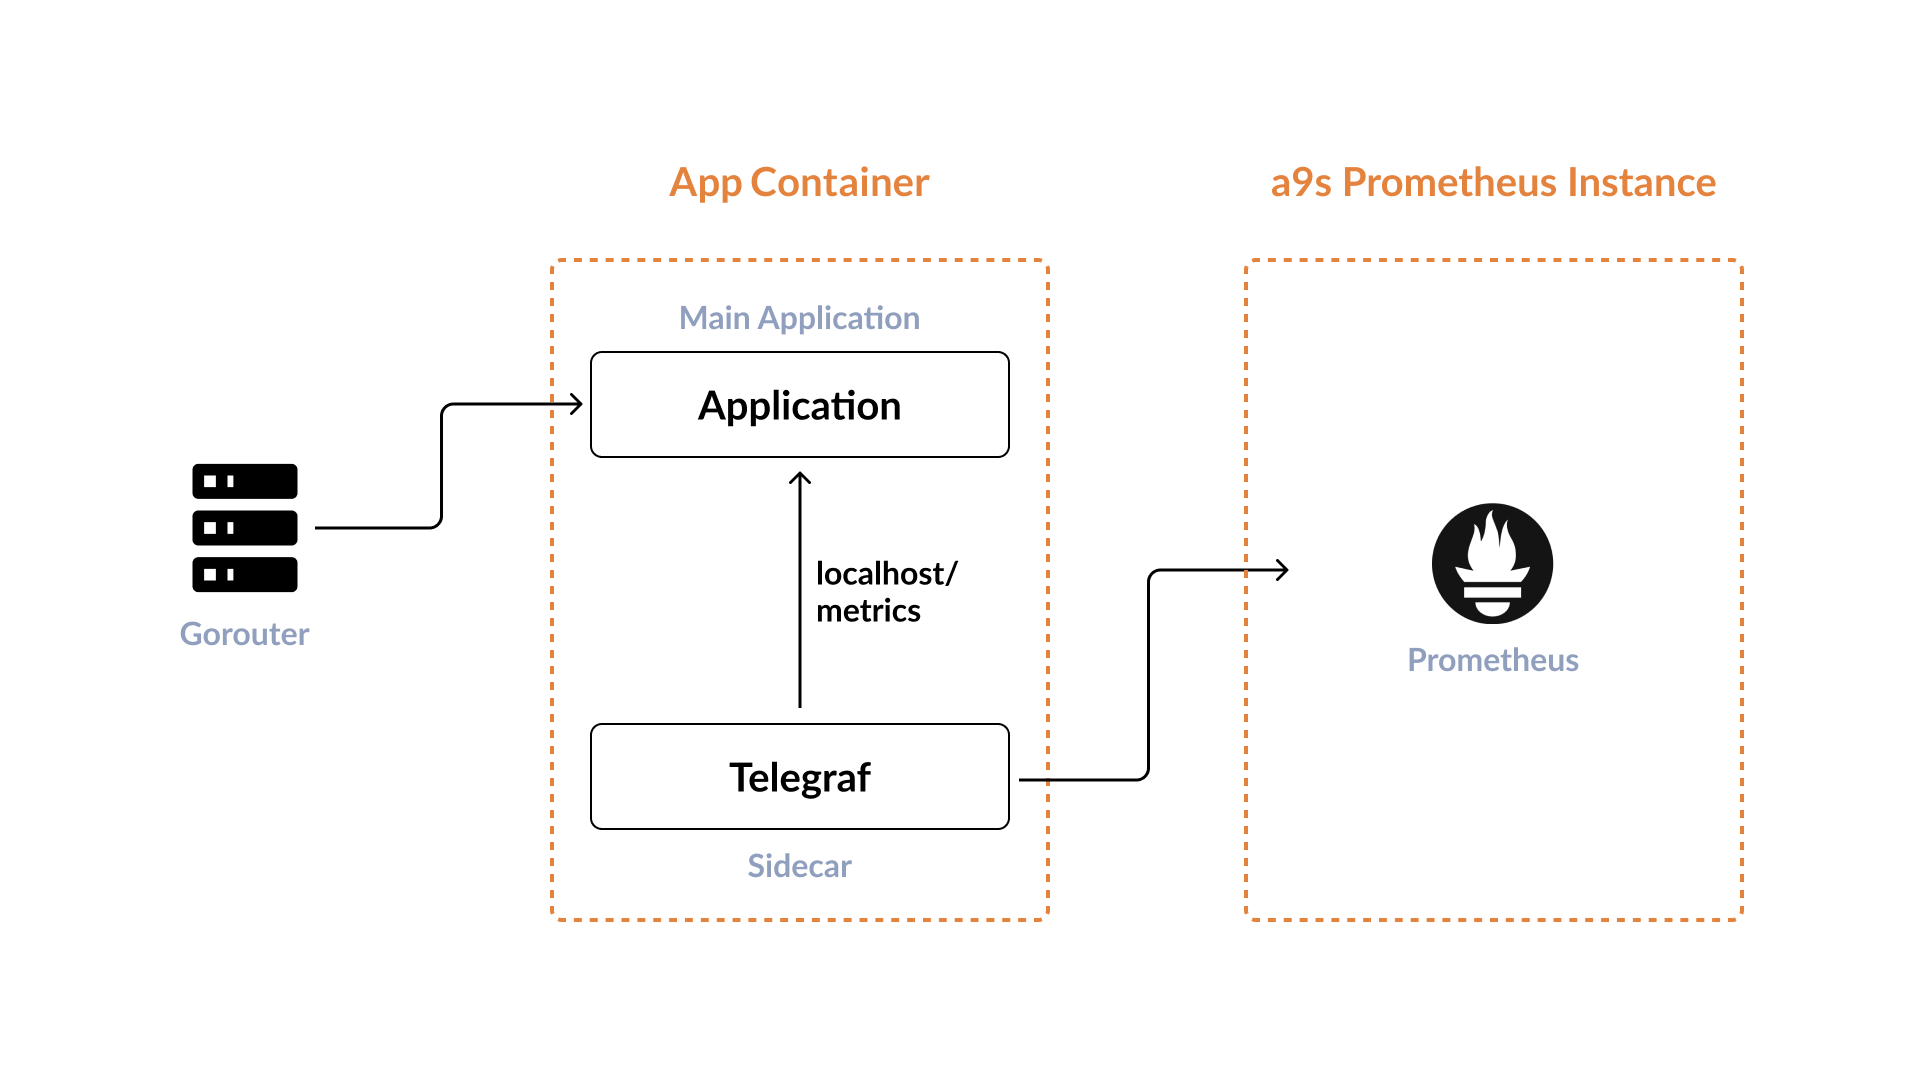
Although Prometheus does not work this way, there is a way around it. Instead of having Prometheus scrape the metrics endpoint, the metrics can be sent to a Graphite Exporter endpoint, which is then scraped by Prometheus.
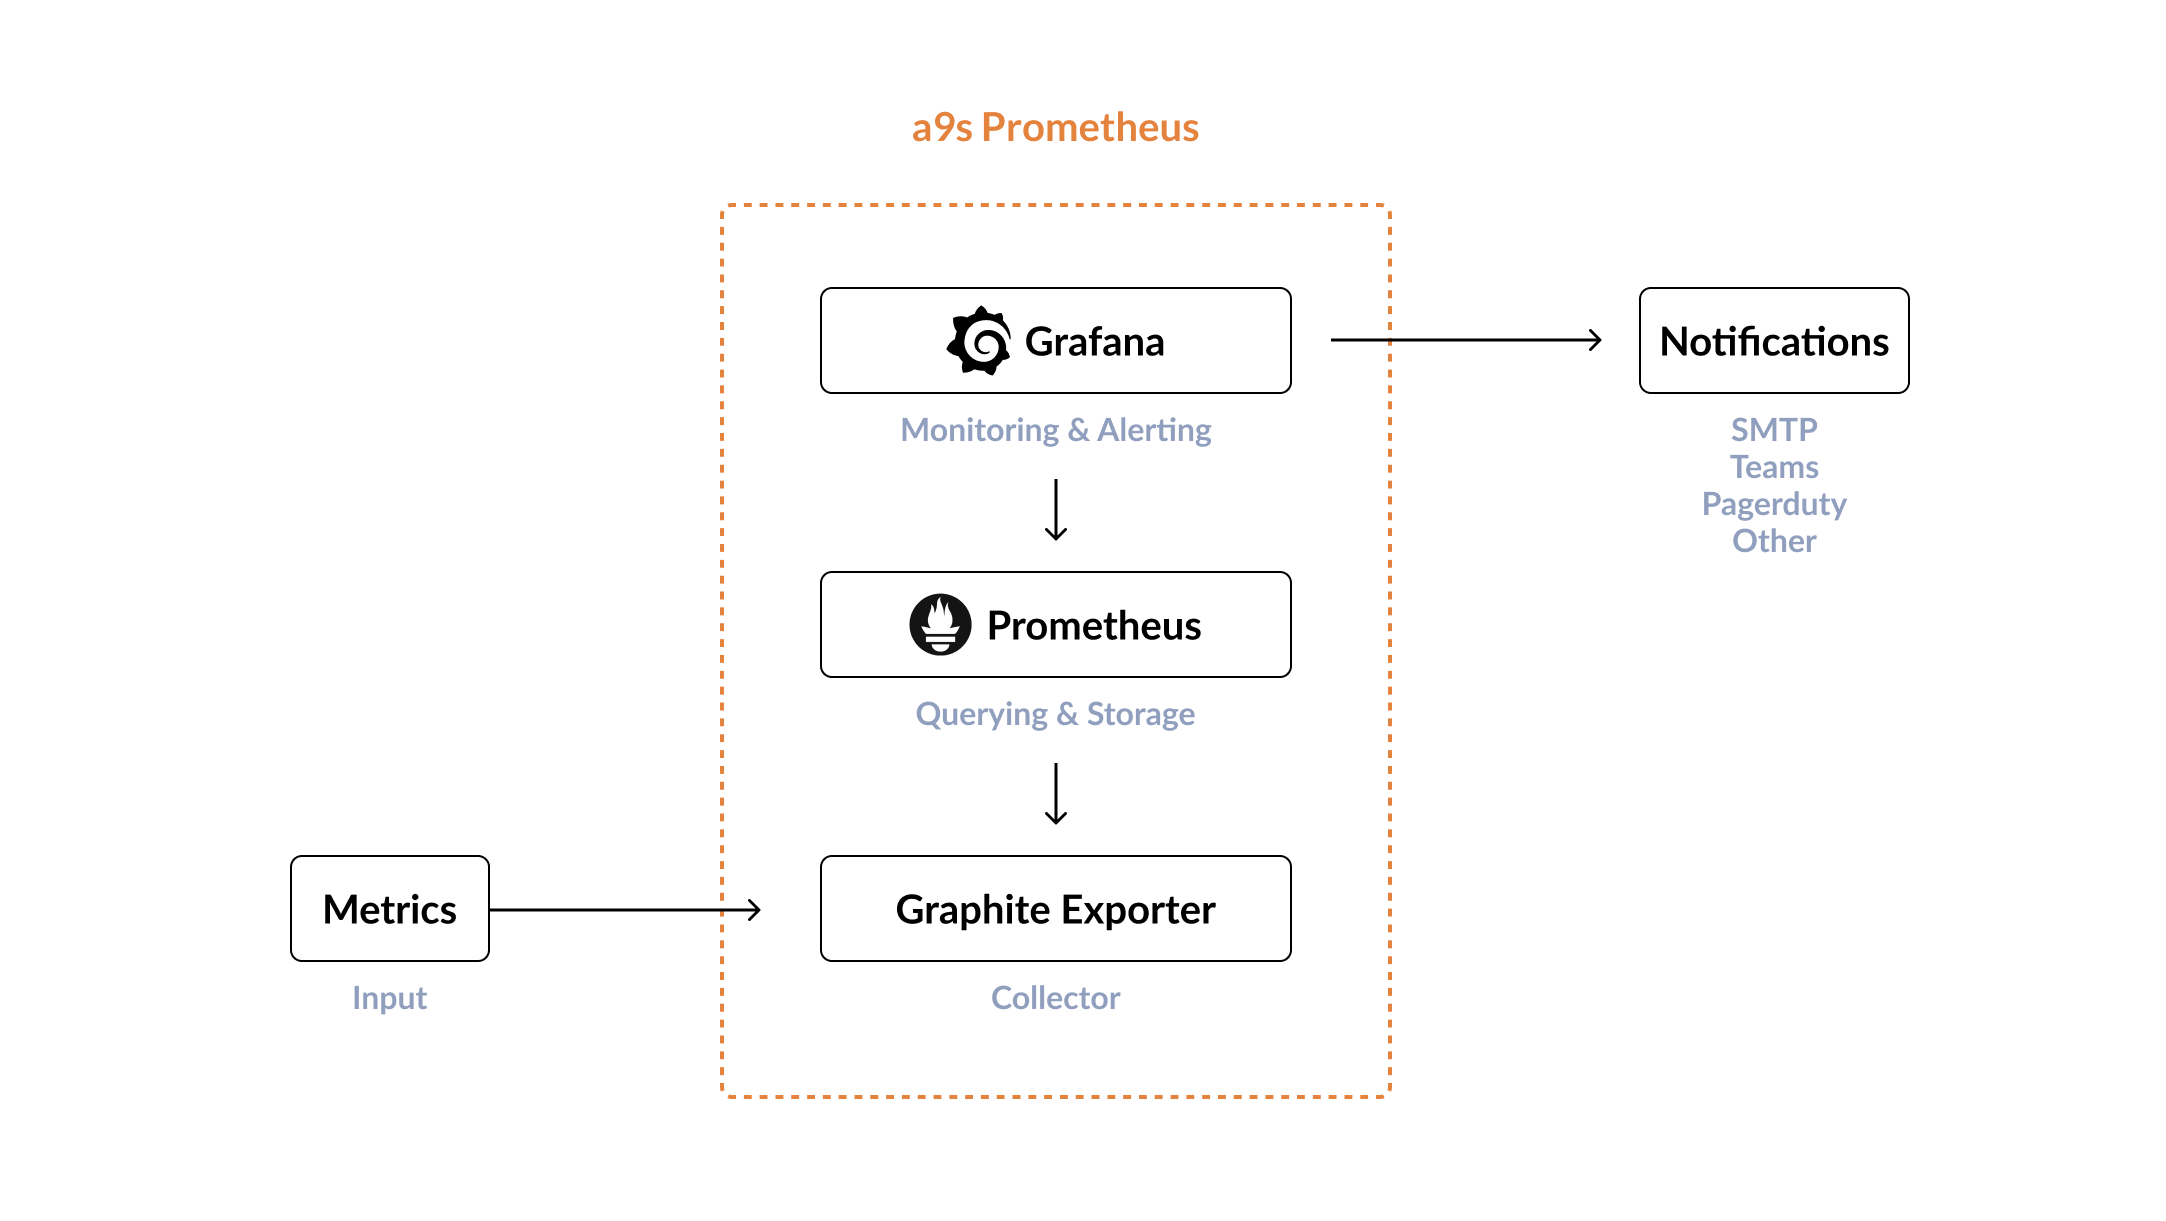
a9s Prometheus contains Prometheus, the Prometheus Alertmanager, a Graphite Endpoint, and also a Grafana dashboard connected to Prometheus. You only need a sidecar deployed in your application container to stream the metrics to the Graphite Exporter.
In this example, we will deploy a simple application to Cloud
Foundry, this application provides a metrics endpoint. The sidecar is packaged in a buildpack and deployed in parallel
with the application via the application's manifest. The actual application is not changed in the process. Thus, the
effort is reduced to customizing the manifest, and only a few lines are added.
The App
The application is written in Go and provides basic metrics in addition to a static page via a separate metrics endpoint using this approach.
The Sidecar
For the sidecar, this example uses the telegraf-buildpack. It includes telegraf which is a plugin-driven server agent for collecting and sending metrics. It is coupled to your application, scrapes the metrics endpoint, and forwards them to a configured Graphite Exporter endpoint. Also, system metrics from your application container are sent to the endpoint.
Deploy a9s Prometheus
a9s Prometheus does not provide the ability to display application metrics by default. This is because the Graphite Exporter has a mapping configuration that transfers Graphite-compliant metrics into Prometheus metrics that are enriched with tags. By default, the Graphite Exporter is set to strictly adhere to these mappings and reject others. However, you can change this configuration by setting the 'mapping_strict_match' property to false.
Checkout the Sample Application
Check out the application with git clone and have a look at the application manifest.
$ git clone https://github.com/anynines/a9s-metrics-sample.git
Change into the directory.
$ cd a9s-metrics-sample
The Application Manifest File
The repository already contains the manifest file. There are three important parts.
In the
buildpackssection, thetelegraf-buildpackis already at the beginning of the list. Do not change the order, as this may cause a deployment error. You can find the official repository here.The buildpack is designed to automatically use a bound a9s Prometheus Service Instance. Therefore, you must define the service to bind in the
servicessection. Cloud Foundry and the a9s Service Broker will then automatically take care of the necessary parameters to connect to the a9s Prometheus Service Instance.If you use another Prometheus offering, or if either the instance name in
VCAP_SERVICESor your application differs froma9s-Prometheus, you have to set the env variablesGRAPHITE_HOSTandGRAPHITE_PORT.env:
GRAPHITE_HOST: phd31bf28-prometheus-0.node.dc1.consul.dsf2
GRAPHITE_PORT: 9109
Push the App
Simply push the application with the cf push command.
$ cf push